


Third day of the Data School Week Tip. In the last post I have talked about how to use sets across data sources. Today I will talk about different data sources again, but this time it’s about filtering more than one data source using parameters. It’s a neat little trick to add some WOW factor to a dashboard, especially for those who appreciate how hard it is to use more than one data source in BI applications.
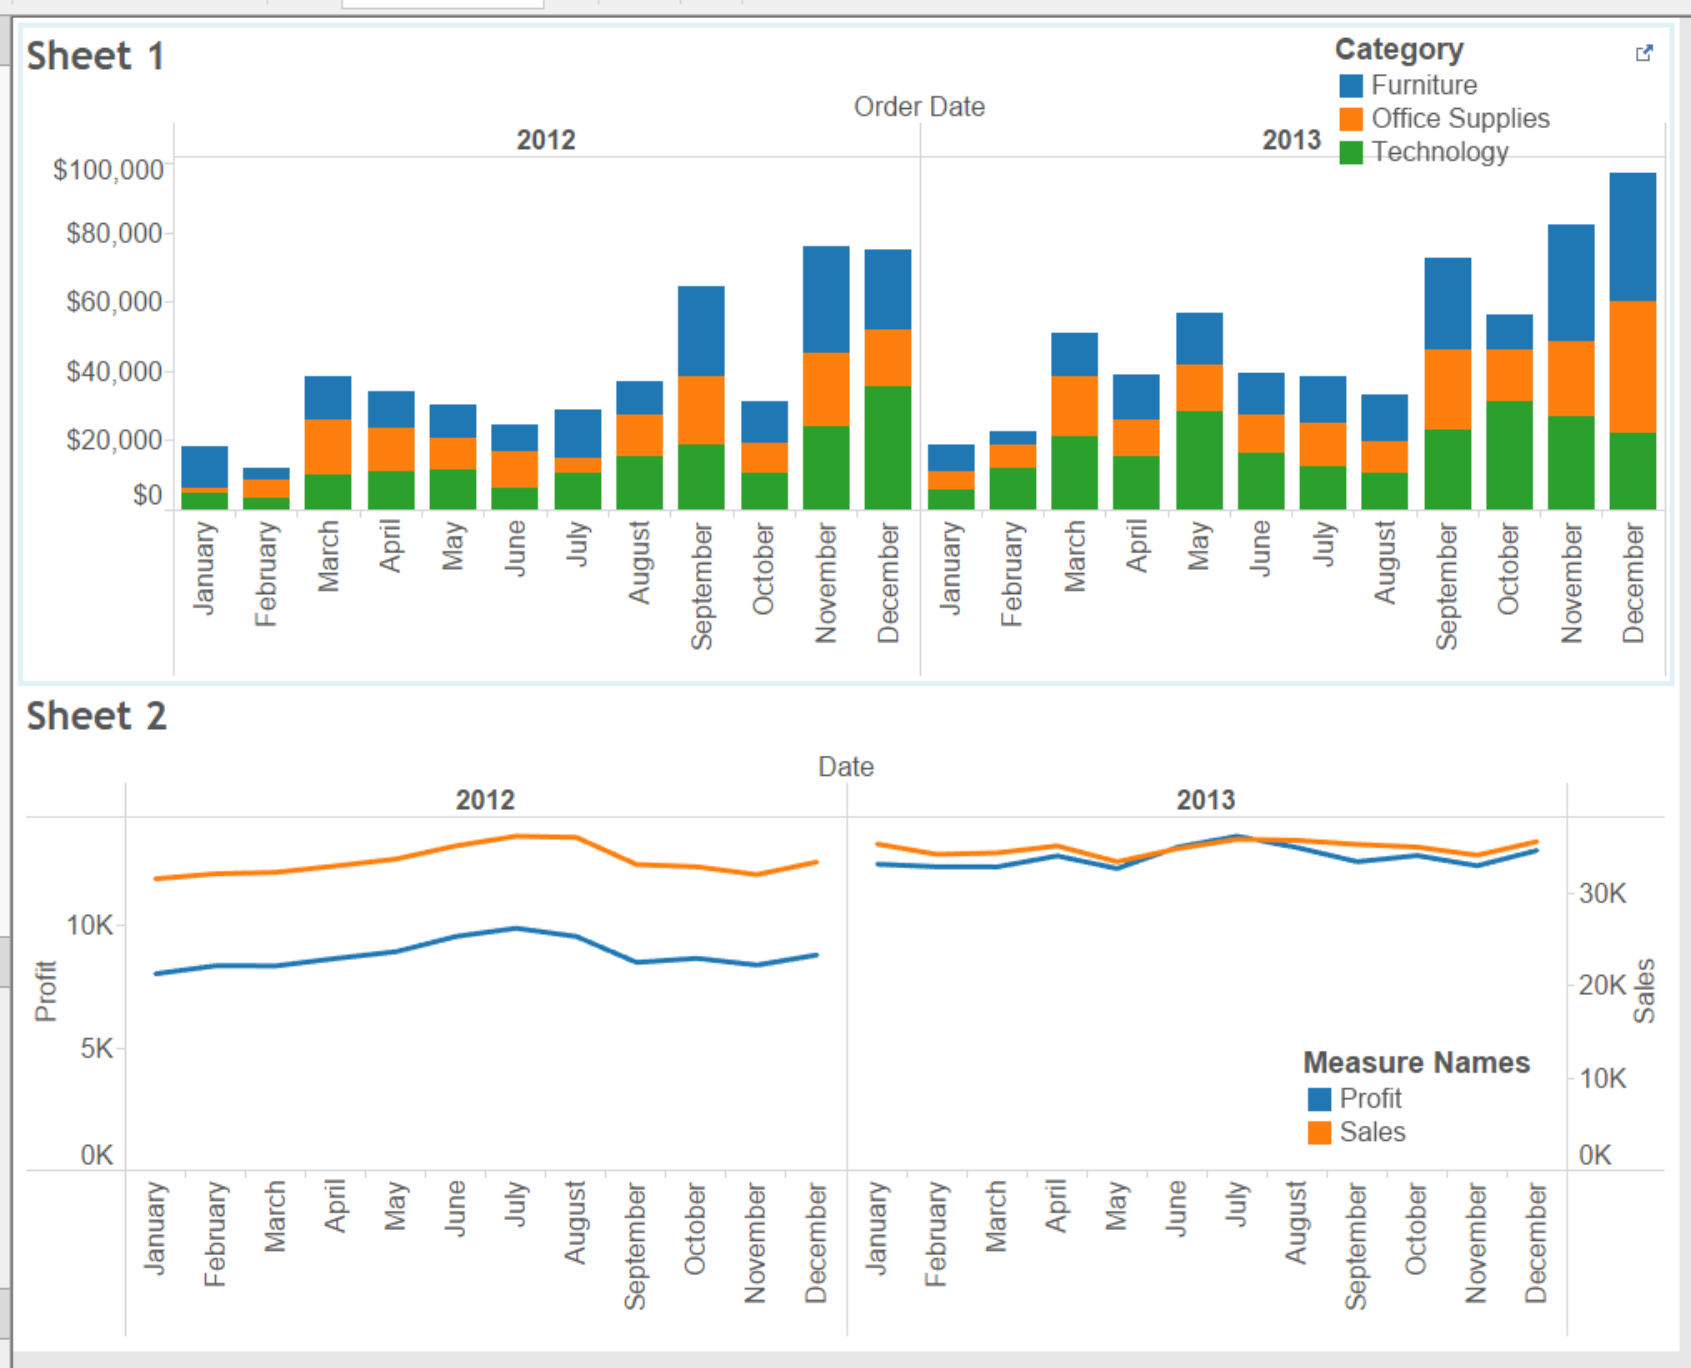
For this example I have used the Superstore and the Coffee Chain datasets. Boring, I know, but they get the point across. These datasets can be blended by using the field State, which they have in common. So go ahead and create two views, one for each data source. It is not necessary for State to be in the view. Here is the dashboard with the two worksheets I have created:
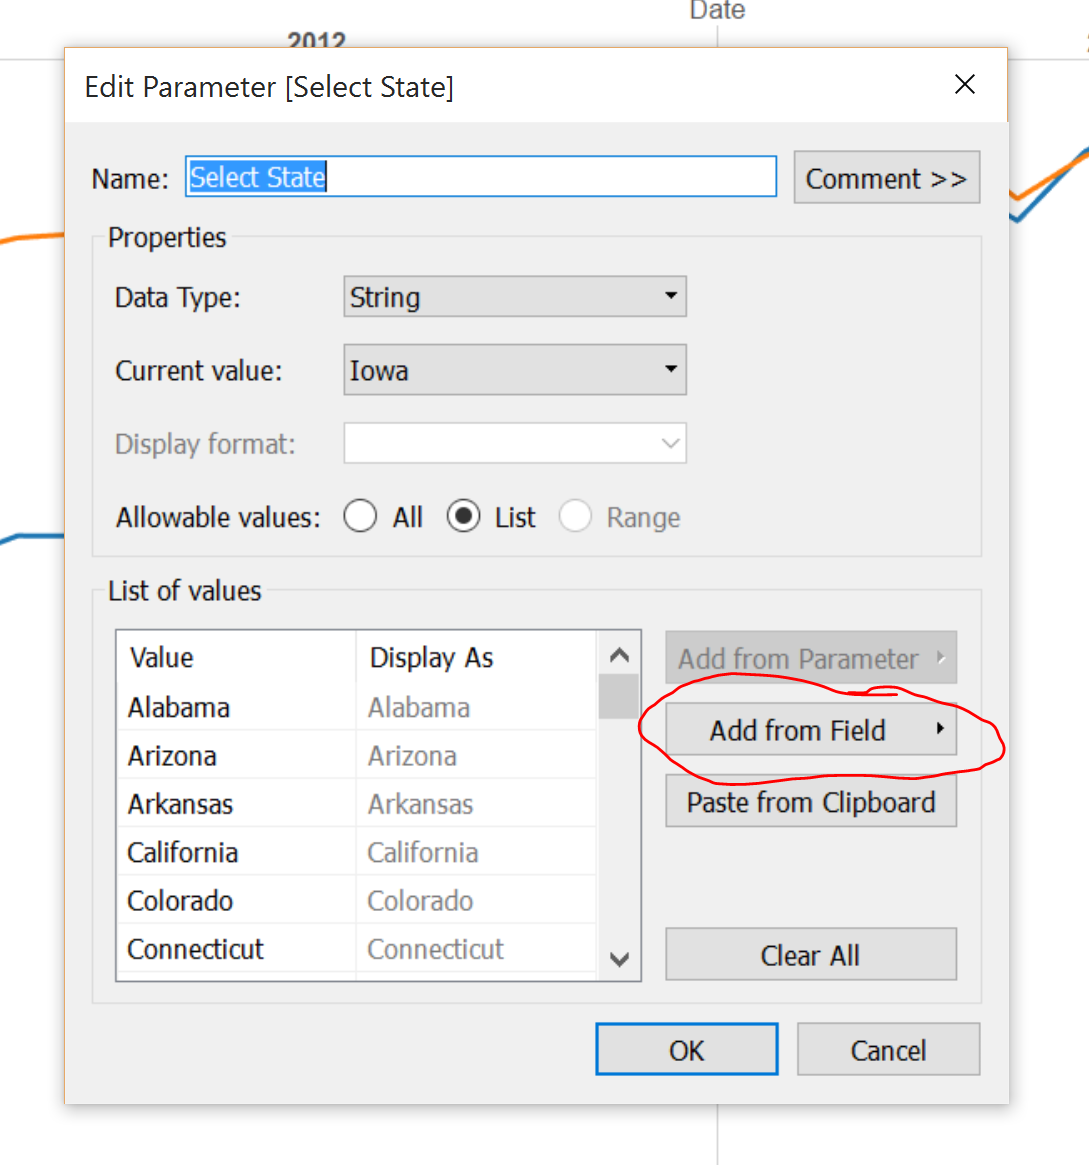
Next we are creating our parameter, which will be a string and whose values can be loaded from the “State” field.
The third step is to create a calculated field for each data source. This calculated field is a boolean that checks whether the value in the parameter is the same as the value in the state field.
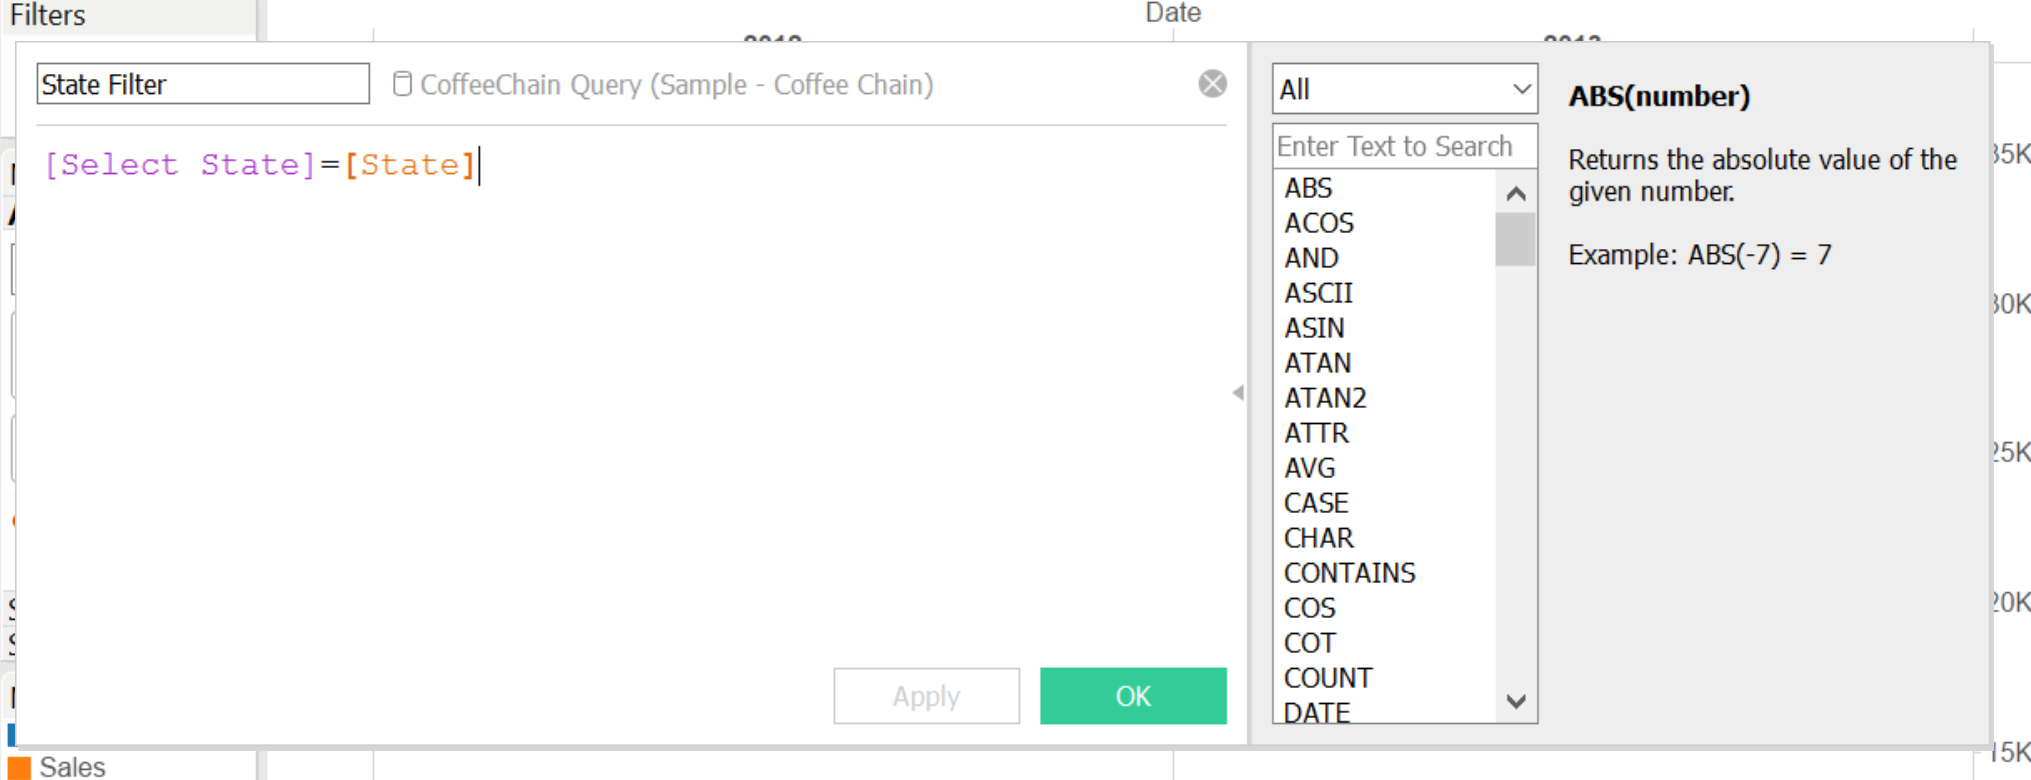
Finally, drag this field in the filters mark in each worksheet and set it to true. If the only value you can see is false, remove the filters from all the worksheets and try again.
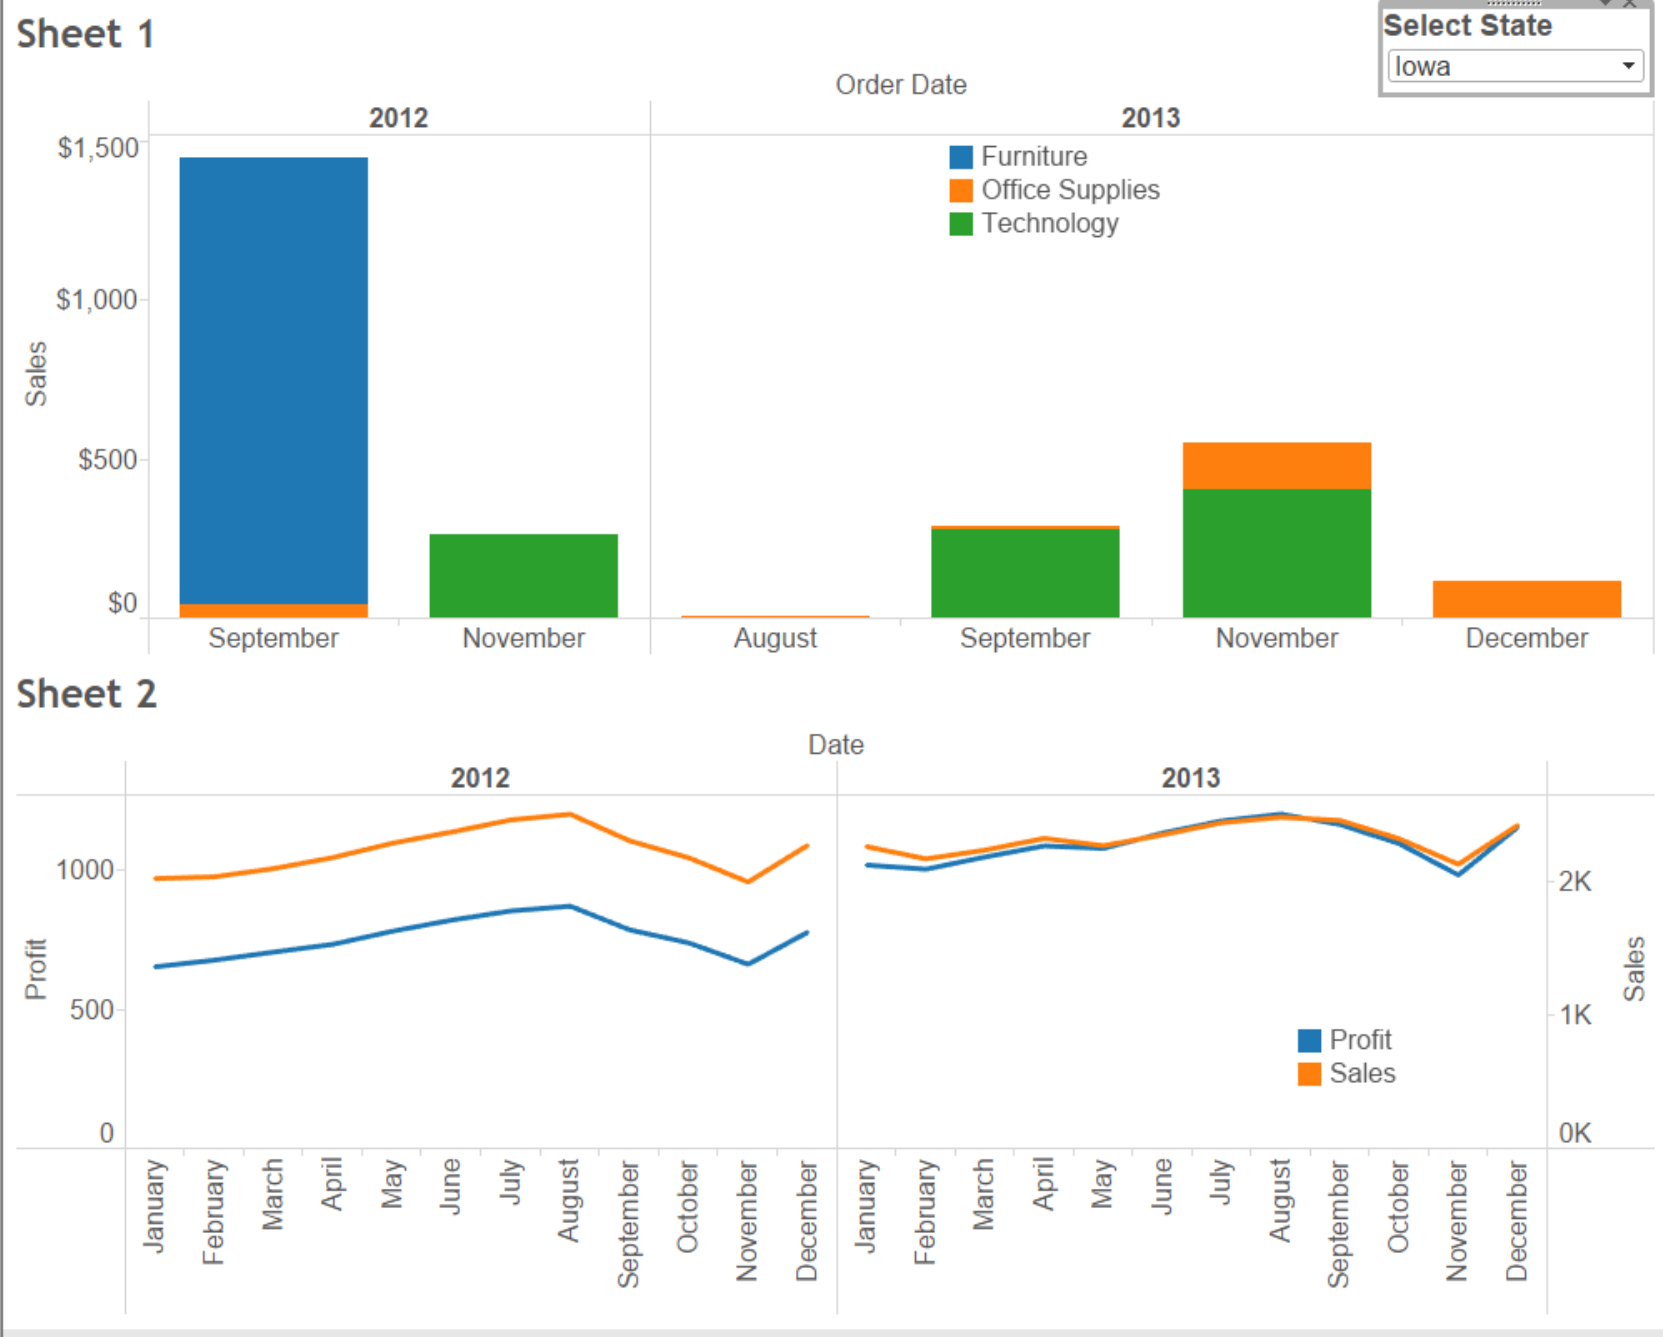
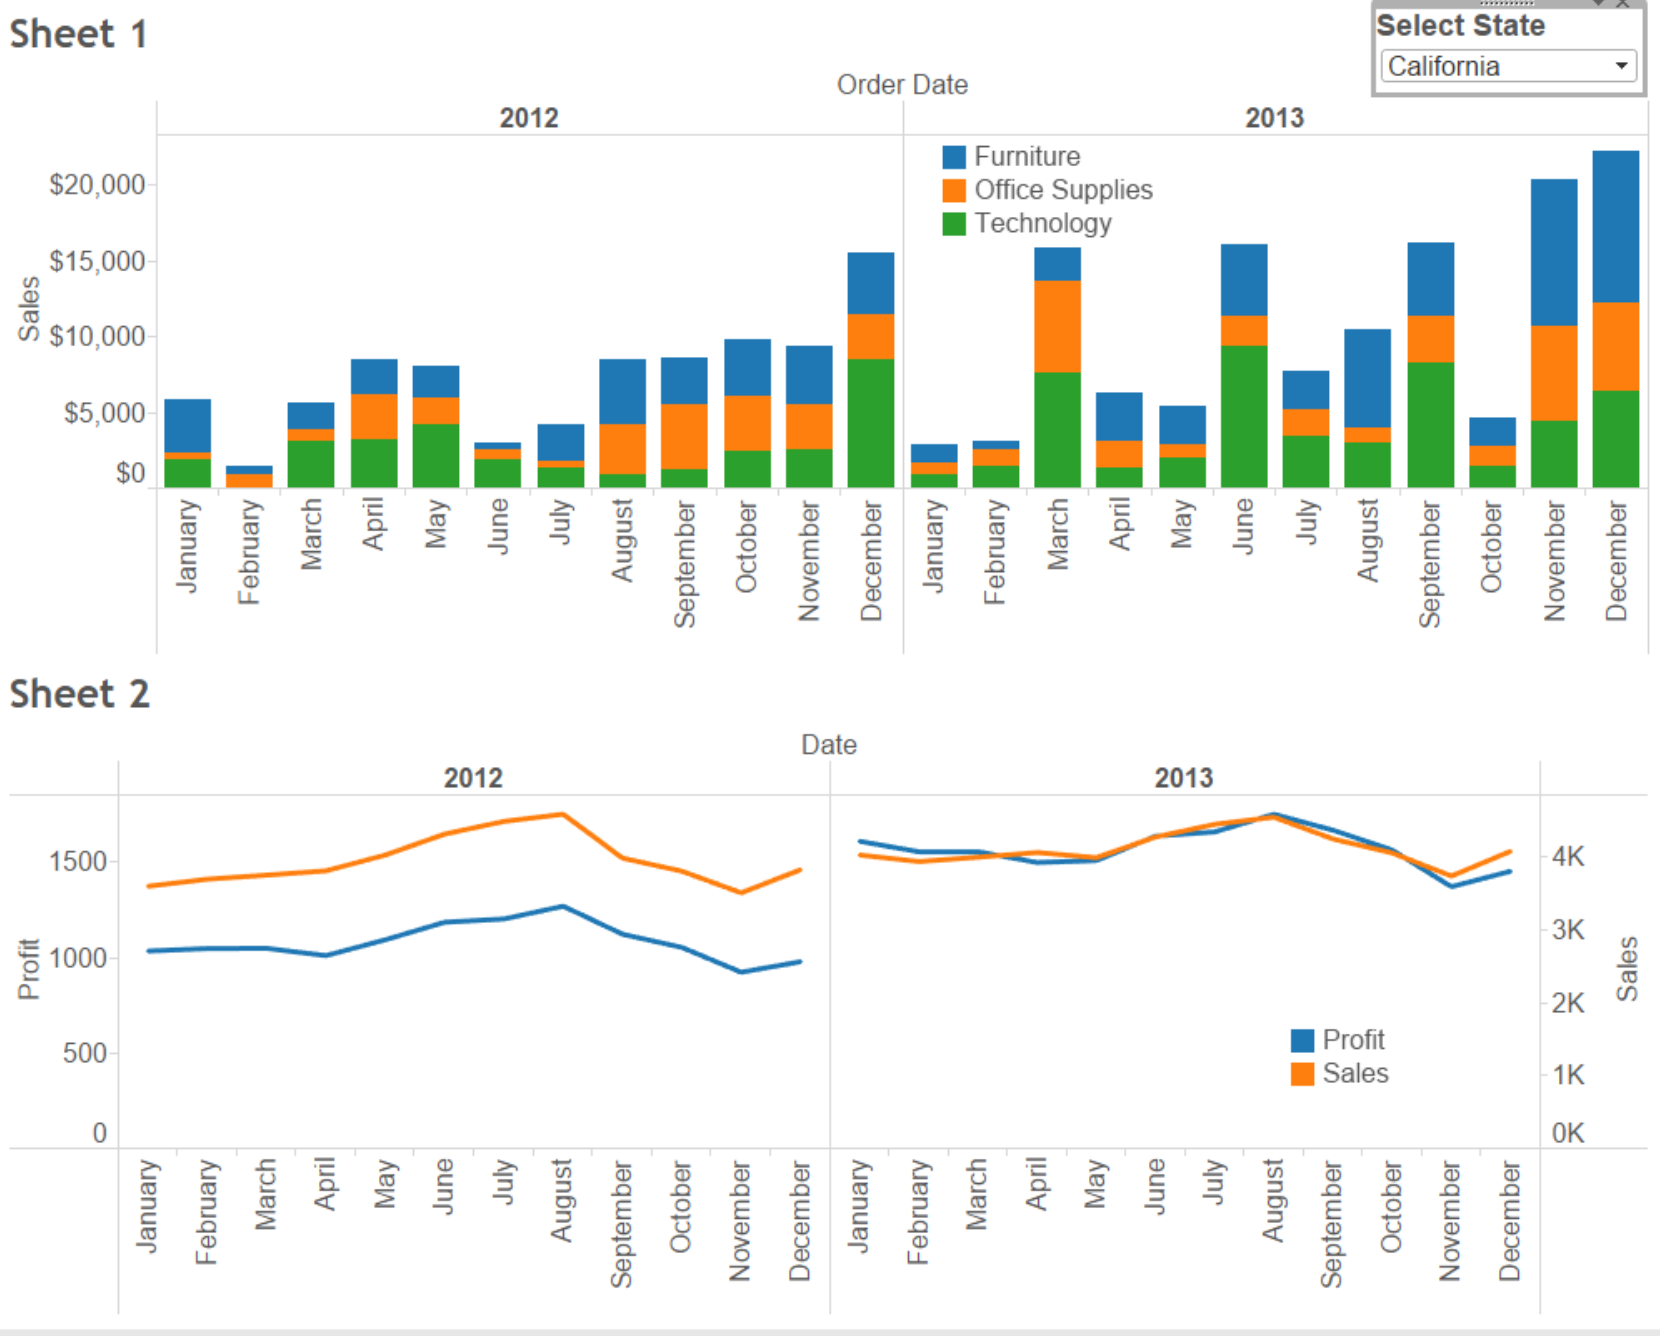
Now create your dashboard with your worksheets and add the parameter you have created in the second step. As you can see, every time the user changes the value inside the parameter, the view is filtered accordingly. Here is the view for Iowa:
And here is the view for California:
Have fun! See you tomorrow for the next tip 🙂