


When working with data to create visualisations in tableau it often helps to pivot the data. This means that we go from having a separate column for each metric to a column for metric name and a column for values.
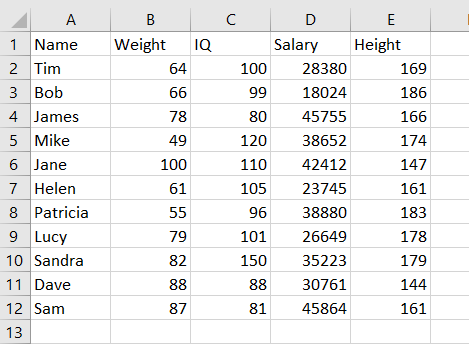
In this example we want to go from data shaped like this:
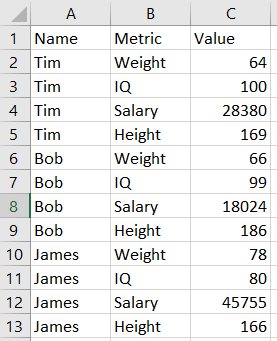
to data shaped like this:
Pivoting the data makes certain visualisations possible in Tableau that would be very difficult or impossible otherwise. Repeating formatting across sheets is also much faster if you are just filtering by metric rather than using a different field.
There are several ways we can pivot the data for use in tableau:
- Use the Tableau plugin for Excel (Installing the Tableau Add-In for Reshaping Data in Excel).
- On the data pane in Tableau by selected fields, right click then click pivot
- Write some custom MYSQL using the union function or doing a more advanced pivot as described by Stephane Faroult
- Use the transpose function in Alteryx
The advantage of using Alteryx to transpose the data is that it will work on several types of data source. Tableau’s in built pivot function does not work for live connections, which makes it redundant for a lot of projects. You can also rename the transposed fields at the same time. Below is an Alteryx workflow that transposes the data shown above:
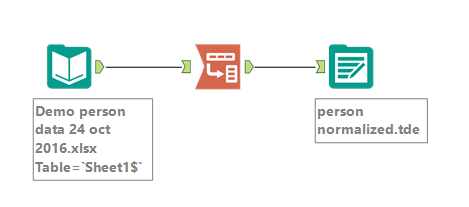
The red icon is the transpose tool which can be found under the Transform tab. In this case I have placed the transpose tool between an input (excel sheet) and output (tableau extract). Once the transpose tool is added to the workflow, click on it to see the configuration settings in the pane on the left:
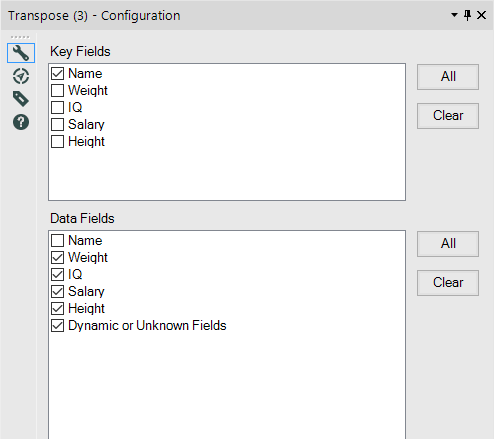
You need to select whether fields are to be treated as key fields or data fields. The key fields are the fields that you will pivot around, whereas the data fields are the fields which will be separated out into individual rows. The new fields created are named ‘Name’ and ‘Value’. The ‘Name’ field contains the data fields (weight, IQ, Salary, Height) and the ‘Value’ field contains the corresponding value. For each name in the database there are now 4 rows (one for each metric) rather than one. You will also spot that ‘Dynamic or Unknown Fields’ is ticked under the data fields. This means that any further columns we add to the data will automatically be pivoted when we re-run the workflow. This could be really useful if your data source has been updated with new columns.