In Tableau, the default behaviour is for all data to be aggregated by whatever dimensions are in the view. This includes and dimensions which are on the rows and columns shelf as well as the marks card. There are occasions however, when we need to aggregate by a dimension which isn’t in the view.
To change the level of detail in a view, we can use a level of detail calculation. Today I am going to look at an example using include. Include allows you to add an extra level of detail into a view. Let’s answer an example question using Superstore data.
Q. Which country has the highest average of orders per customer?
An easy error to make would be to assume that we can use a simple calculation of count of orders divided by count of customers:
countd([Order ID])/countd([Customer Name])
This would be incorrect, however as customers who have placed a large number of orders will not skew the result as much as they should. Instead we need to aggregate on customer name before averaging the result.
AVG({ INCLUDE [Customer Name] : countd([Order ID])})
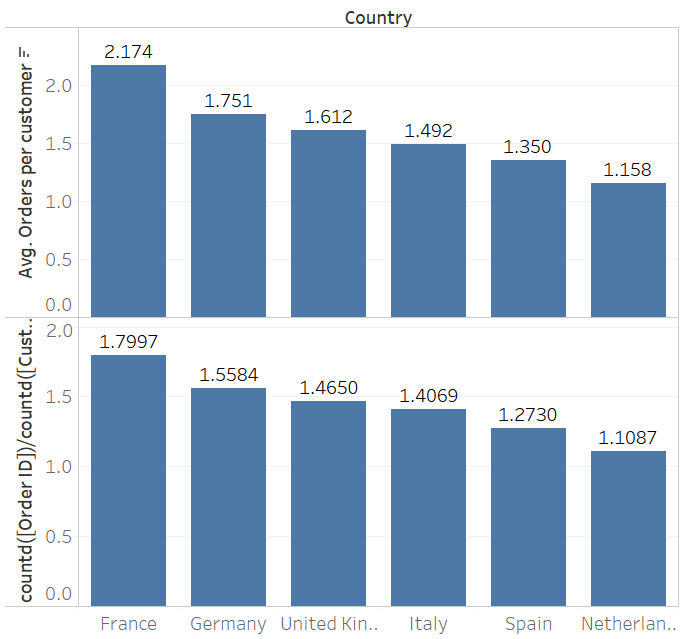
The charts below show the differences between the two approaches. The top bars were created using the INCLUDE calculation, whereas the lower bars are just countd([Order ID])/countd([Customer name])

These minor differences could have major consequences if used to make business decisions so it is important to understand what is going on here. The include approach is calculating the number of orders per customer first, then taking an average of that figure. The other approach is counting orders and customers independently before diving the count of orders by the count of customers.
Understanding at what point you need to aggregate data is key to getting the right output.
Row Level:
Write a calculation (measure) using measures without aggregation, then aggregate once you drag it into the view
eg. [Profit]/[Sales] will give you the profit ratio for each individual item (row) in the superstore data.
Aggregate Level:
Write a calculation (measure) using aggregated measures. You will not be able to change aggregation when you drag it into the view.
eg. sum([Profit])/sum([Sales]) will give you the profit ratio for the entire data set that you have in the view and will be aggregated by whatever dimensions you add to the view.
Custom aggregate level:
Write a level of detail calculation to add or remove a level of detail.
eg. { INCLUDE [Sub-Category] : sum([Profit])/sum([Sales])} will give you the profit ratio for each sub category within the data. This could then be averaged across another dimension (eg. country) when dragged into the view.
