


Tableau has the ability to chart swap in dashboards, but what if we had buttons that made it easier/more slick to navigate this feature?
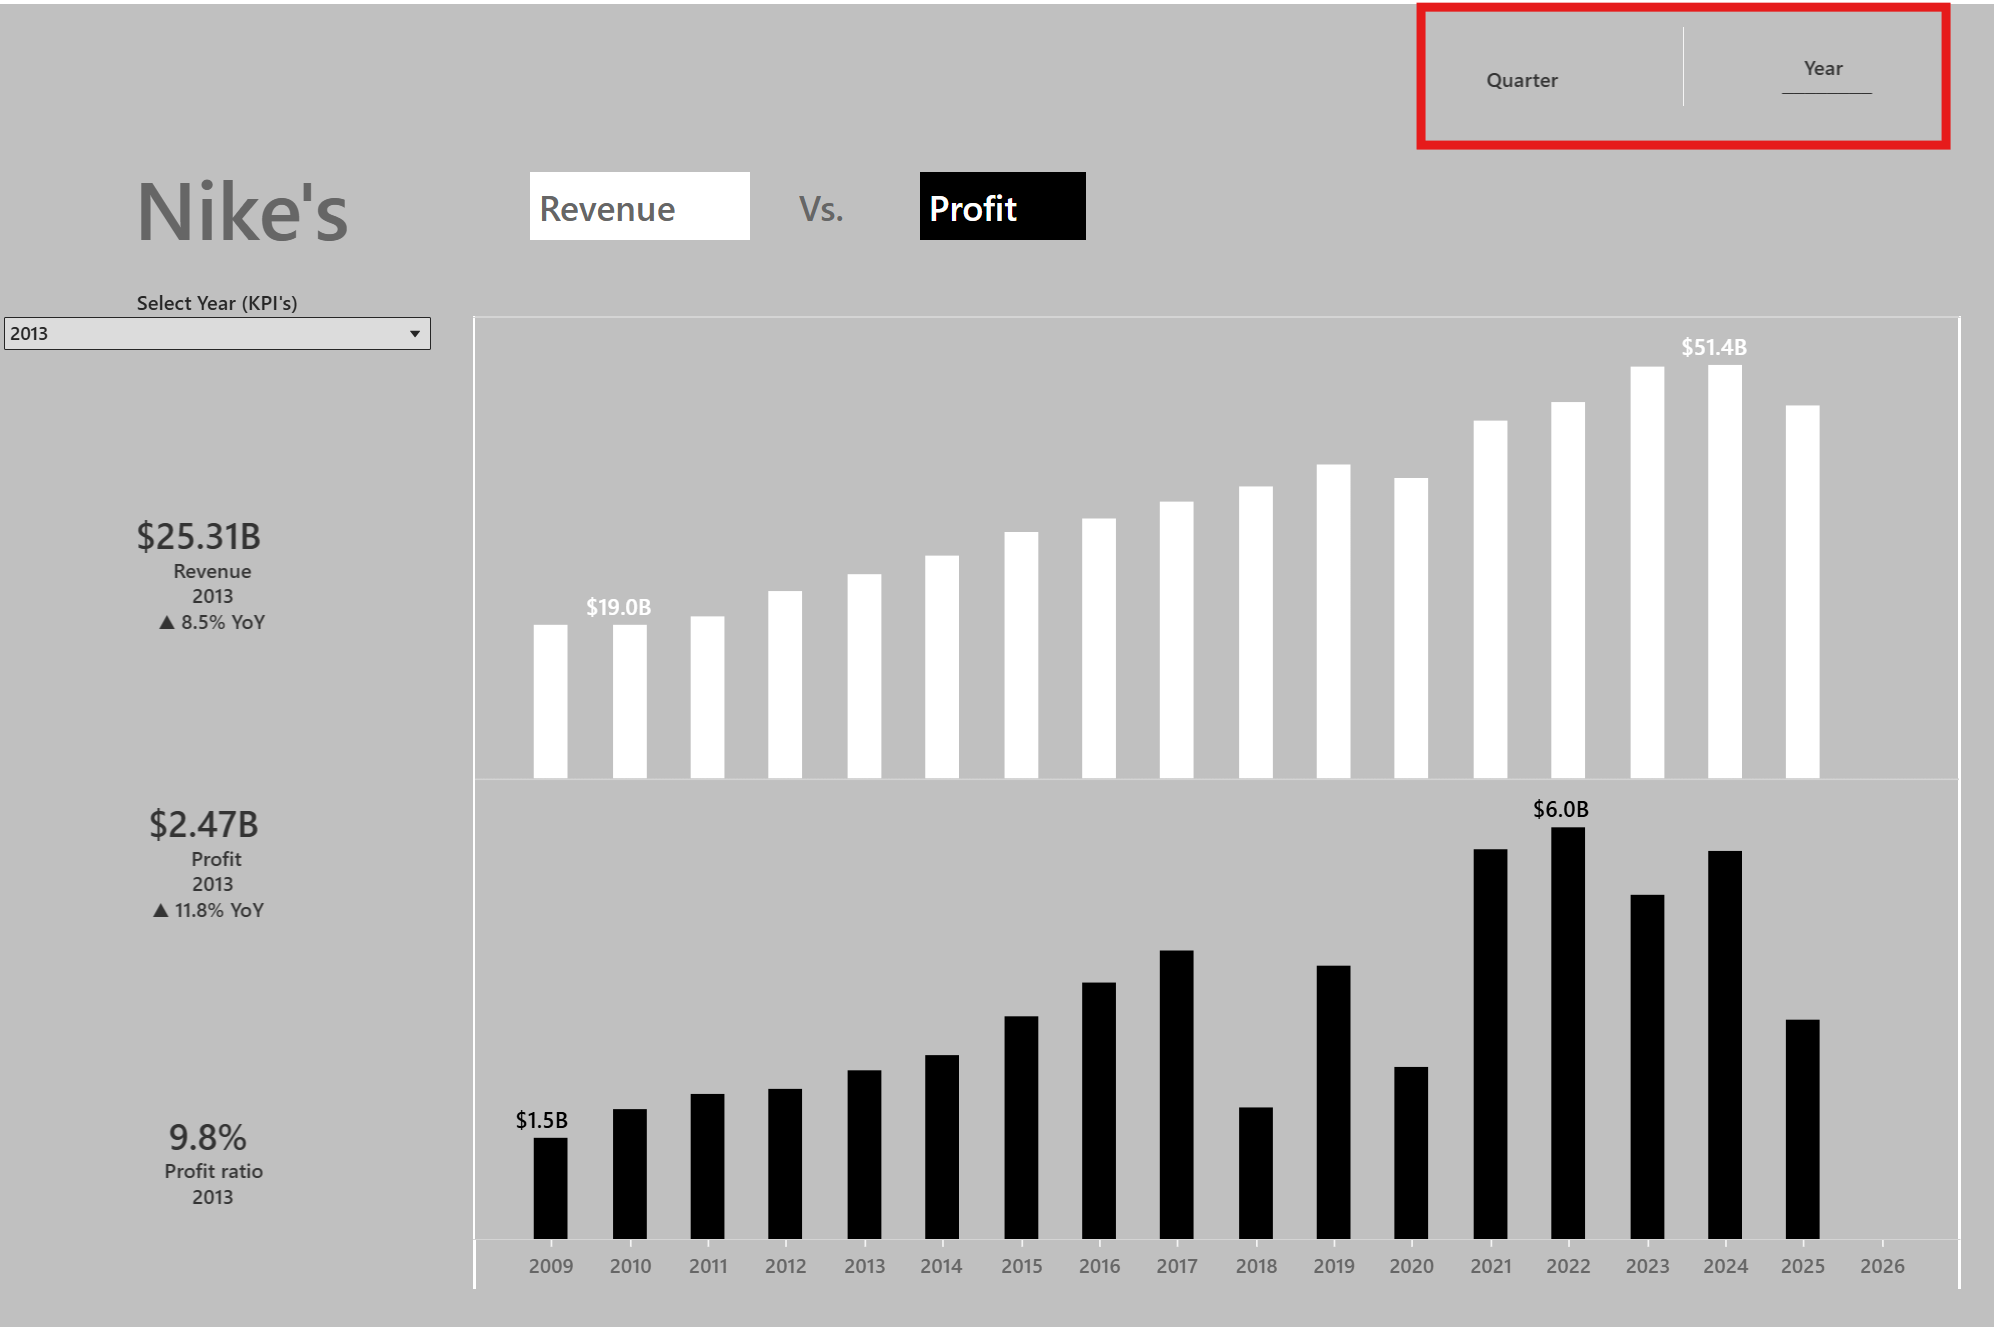
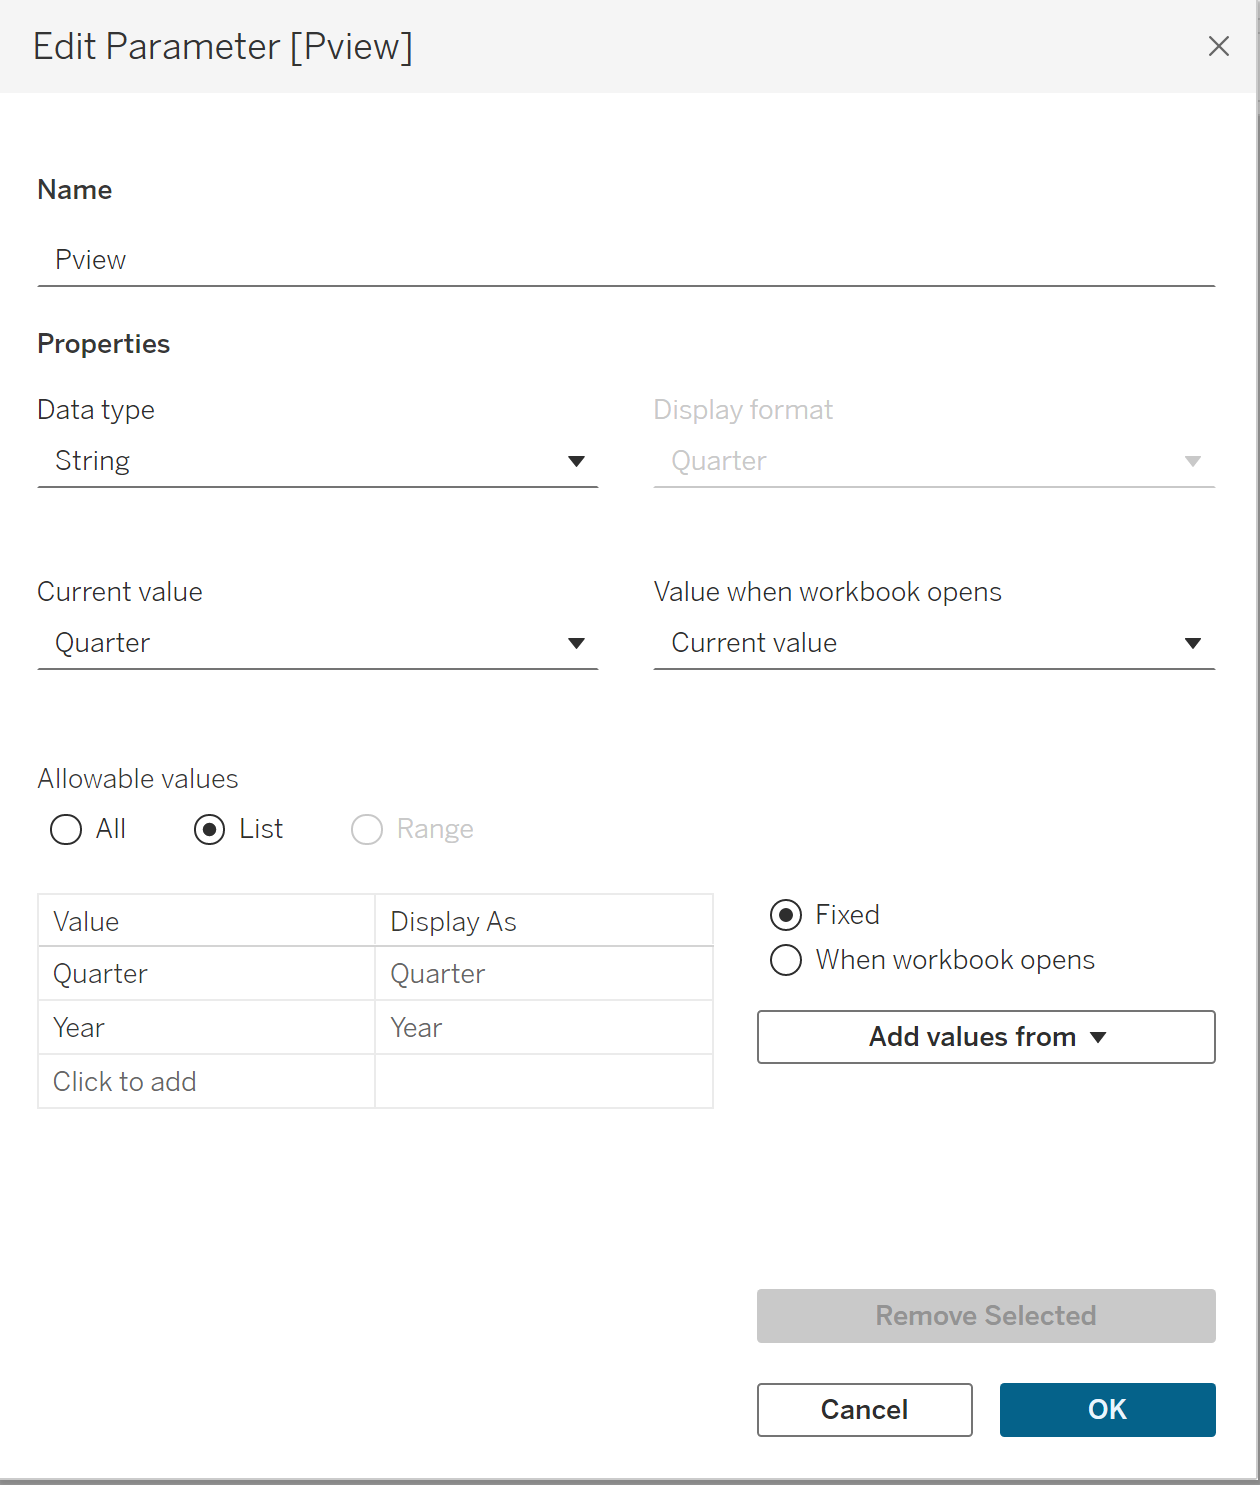
The first step is to create a parameter to seperate between the two views we want to switch between
(In this example we want to switch between the same profit and revenue data for Nike, across years and quarters for the same time period)
Then we can follow with creating the buttons
E.g. for Quarter button:
- New worksheet → drag
MIN(0)to Columns (gives one mark) - Set Marks = Text
- Create calc
Btn Quarter Value="Quarter"→ drag it to Detail and Text - Create
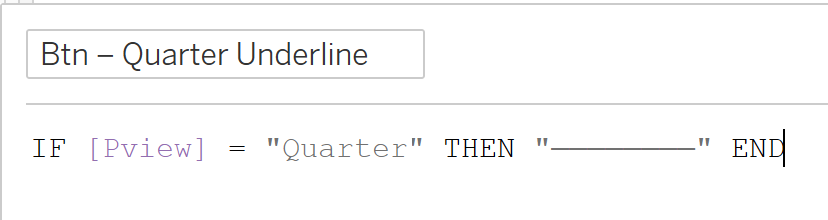
Btn Quarter Line:- This is an optional choice for the user to help them identify which button has been selected.
- Repeat for "Year" button
I found it logical to then create Boolean calcs:
Show Quarter = [pView] = "Quarter"
Show Year = [pView] = "Year"
Apply them as filters:
- On every Quarter chart → add [Show Quarter] to Filters = True
- On every Year chart → add [Show Year] to Filters = True
Then moving onto the dashboard itself its important to place both charts(Quarter/Year) into the same tiled container to allow for the chart swapping feature to work.
The following steps will then walk through the process of creating actions for our dashboard:
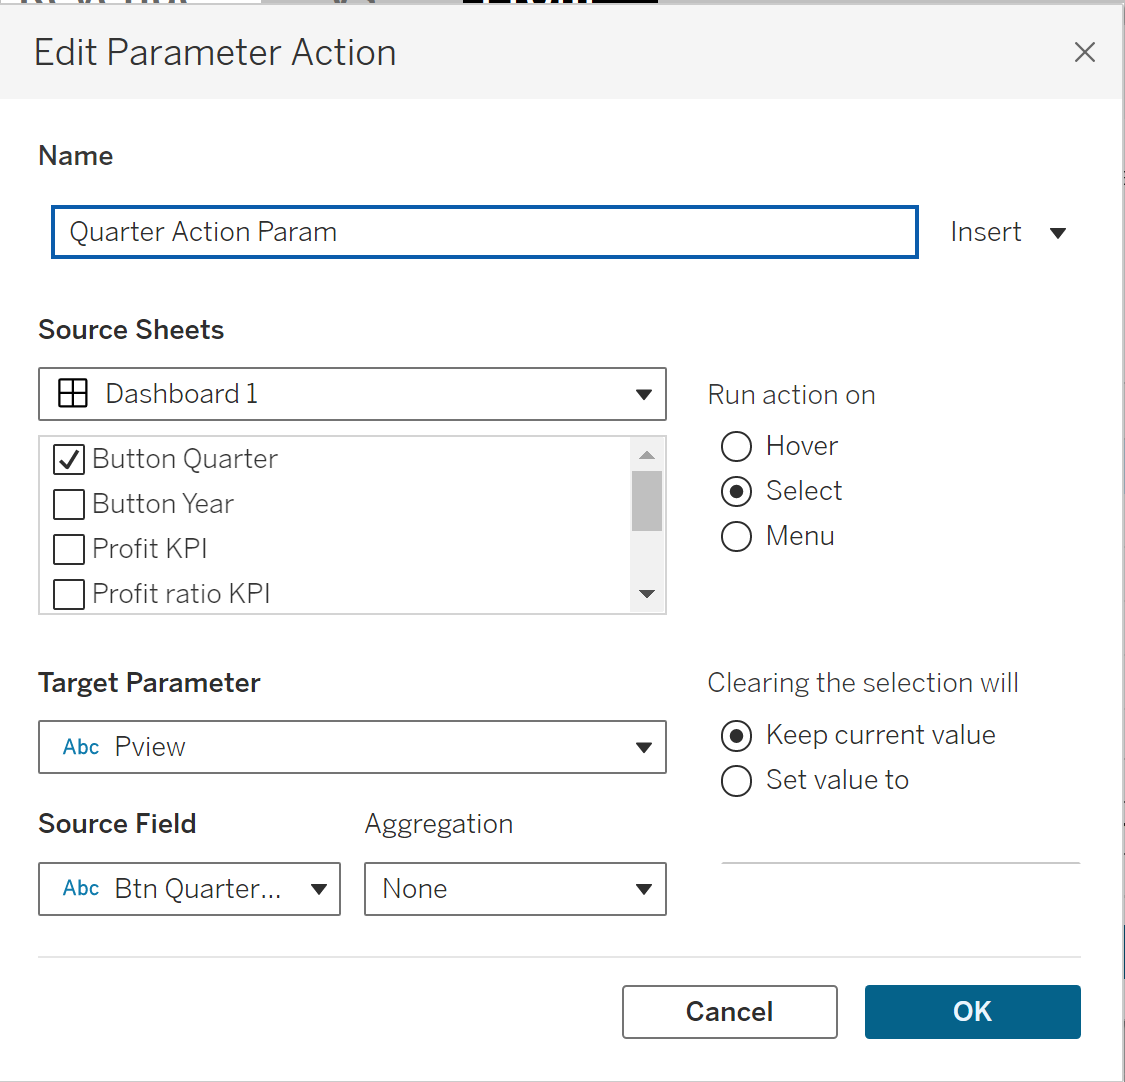
Dashboard → Actions → Change Parameter… (add two actions)
- Action 1 (Quarter)
- Source sheet: Button – Quarter
- Run action on: Select
- Target parameter:
pView - Source field: Btn Quarter Value
- Clearing: Keep current value
*Repeat for Years
And with that we should have a functional dashboard that is able to filter between two views by the use of two buttons for each view
Link to dashboard: https://public.tableau.com/app/profile/david.gandary/viz/NikesRevenuevsProfitNikeProfitRevenue/Dashboard1