


Blog post on bookmarks
Power BI bookmarks are powerful tools that give users greater control over the exact visuals they want to see. They allow analysts to deliver rich insights without overwhelming end users, presenting only the information necessary at a given time.
Business Purposes & Use Cases
- Custom Navigation: Create tabbed visual switches on a single page instead of cluttering reports with dozens of separate tabs.
- Pop-up & Overlay Panels: Toggle slicer sidebars, KPI detail overlays, or definitions on and off without taking up permanent canvas space.
- "Reset Filters" : Give users an easy one-click button to clear all complex filter/slicer selections and return to the default report view.
- Better Storytelling: Pre-configure sequential views (e.g., "Regional Underperformance", then to "Top 10 Loss Products,") to present interactive narratives directly during C-suite meetings without manual filtering.
For this blog we’ll be looking at how to toggle between charts.
Let’s dive into how to use bookmarks using the native Power BI financial data:
To get started, navigate to View in the top menu and click Bookmarks. A side panel will appear, this is where you'll save the specific views you want your audience to see.

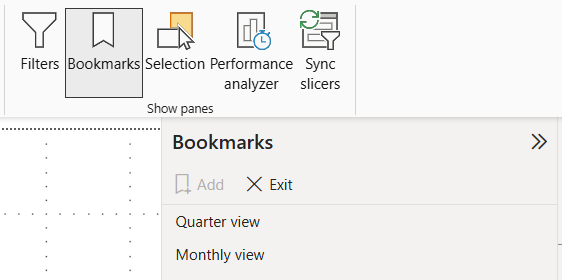
Say your client wants to look at a quarter view for all their sales last year, but they also want the option to see a monthly view. To ensure we don’t take up too much crucial dashboard space we can use the chart toggle.
Here’s how we build it out:
- First, it's good to have all your elements on the page, let's set the charts over each other so they’re overlapping.
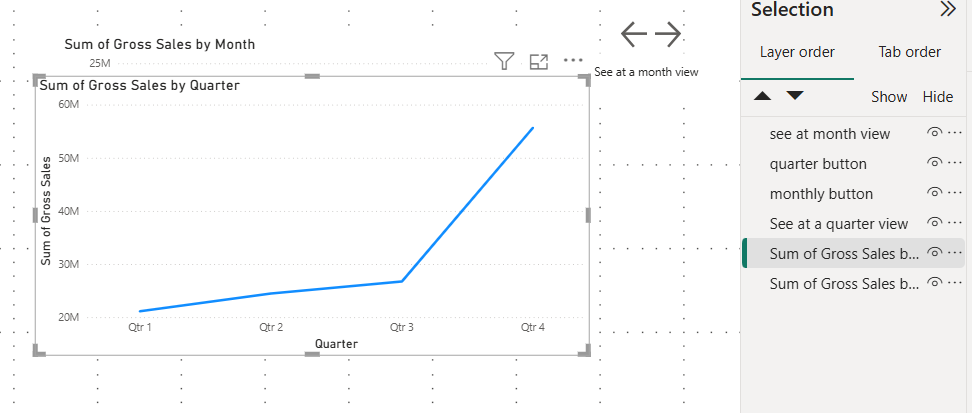
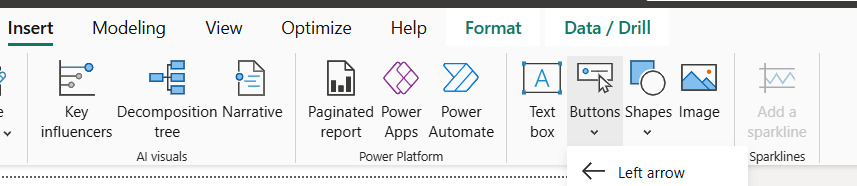
b. Add navigation buttons: Insert your toggle buttons from the Insert tab on the top ribbon. These buttons will allow us to navigate between charts.
c. Let's create our monthly sales view: Set up your monthly layout by hiding extra elements, then click + Add in the Bookmarks pane to save the active view. Double-click to rename, then repeat for your quarterly view.
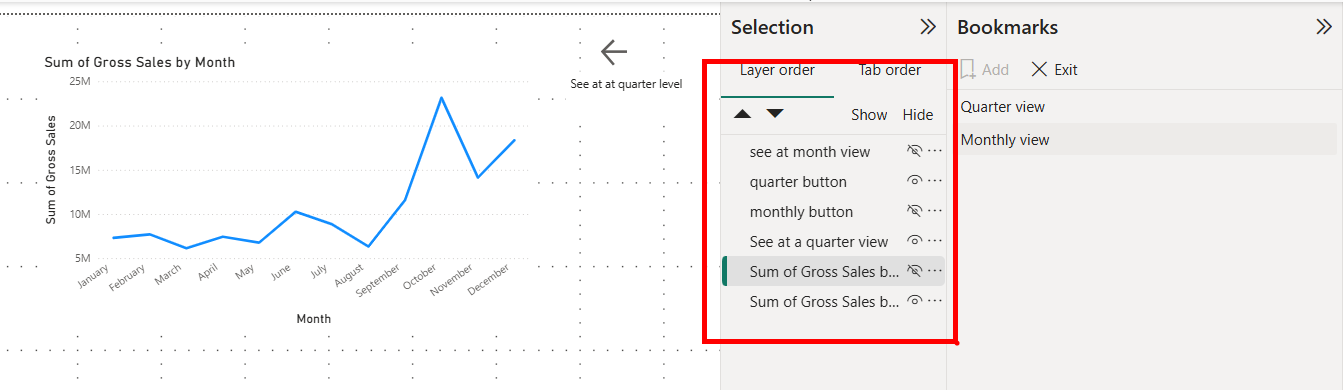
d. Assign actions to your buttons: After saving these views, select a button --> open the format pane --> toggle the action button to “on” --> click bookmark and then the view you want this button to show. Repeat this for the other view.
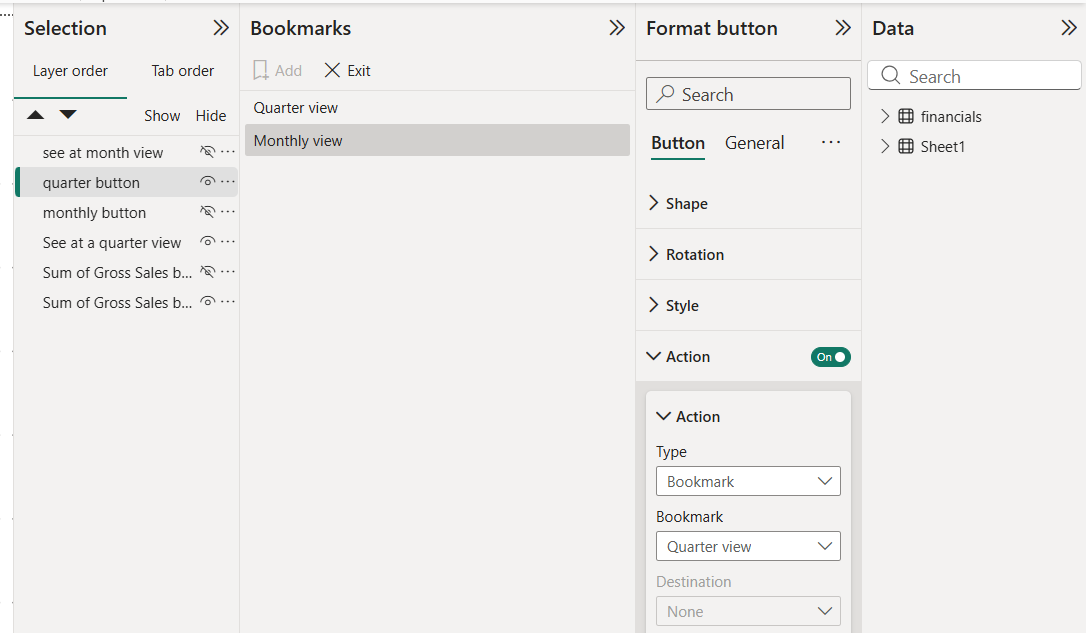
e. To see your buttons in action hold Ctrl and click on your buttons ( for Mac it is Command + click).
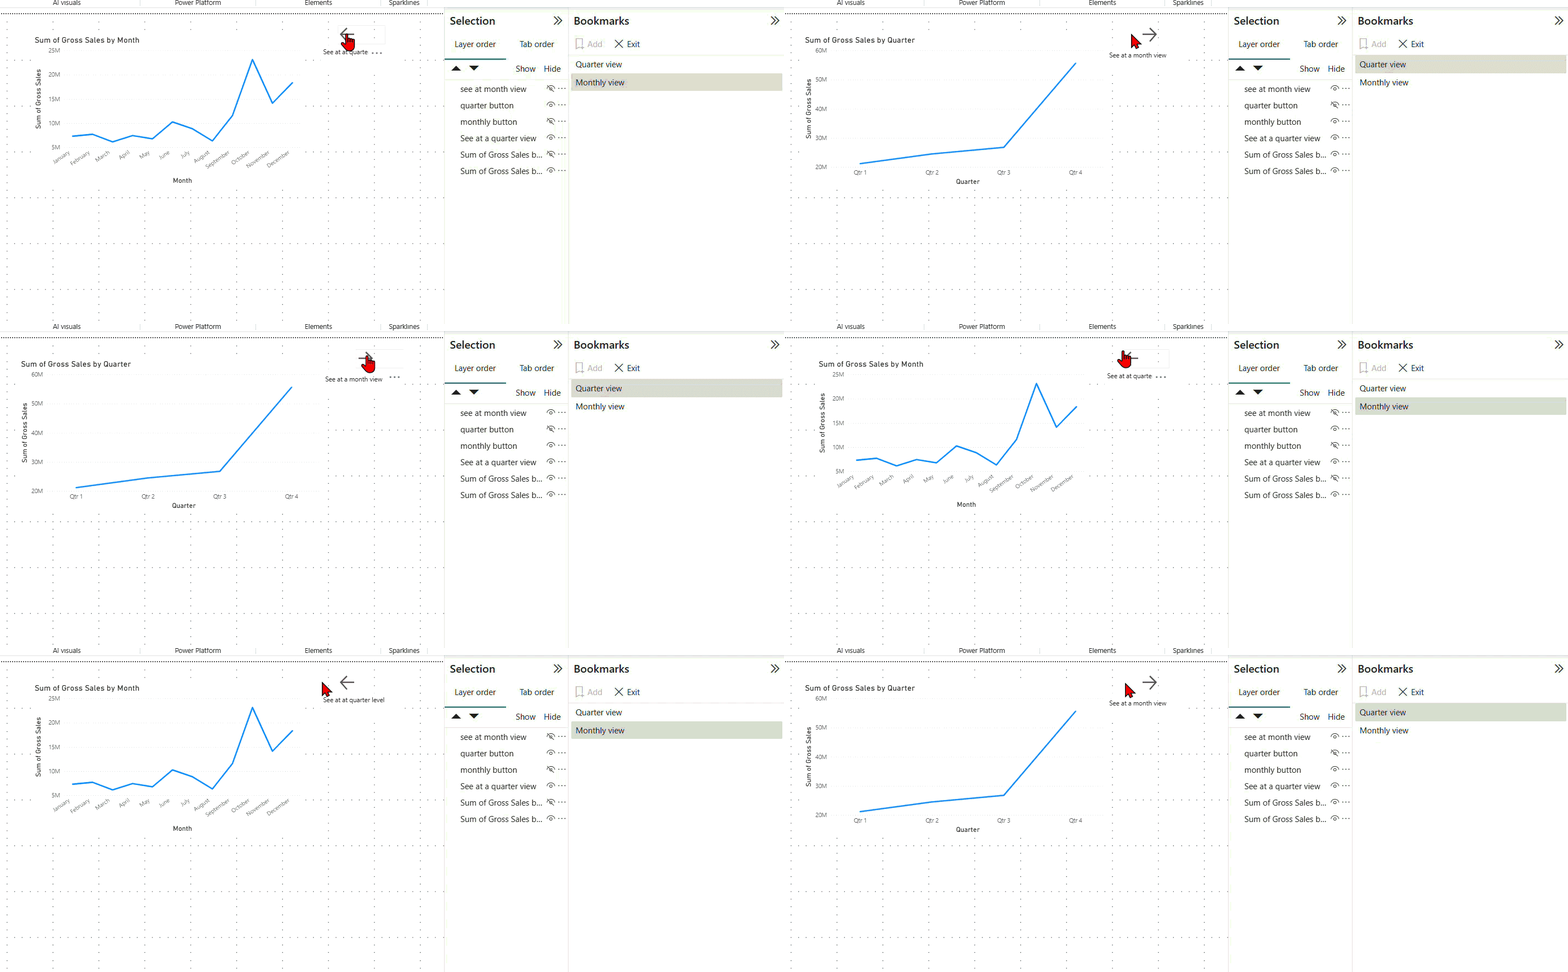
Now you've created two separate view using bookmarks!
Data source (local finances data on Power BI)