After waiting for a little while for the task to be set. The data was released and the subject was fishing!
The data was from Gov.uk and had a lot of interesting information we were told to focus on Section 5 which broke down the fishing in rivers by areas and contained four main tables.
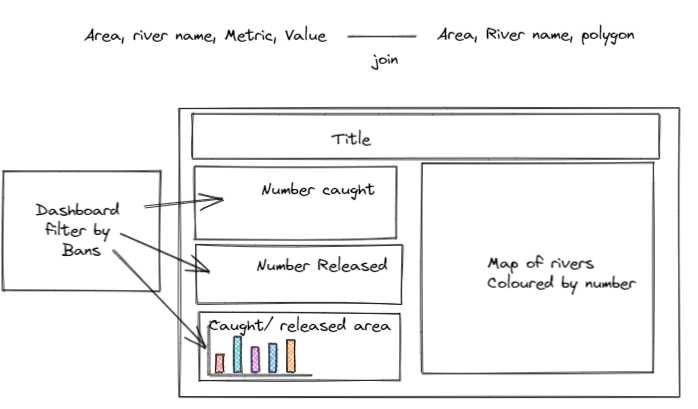
After looking at the tables briefly I hopped into Excalidraw to figure out what I wanted to make using the data.

I wanted to use some spatial so I knew I was going to have to find that somewhere but I decided to work with the main data first to get me started.

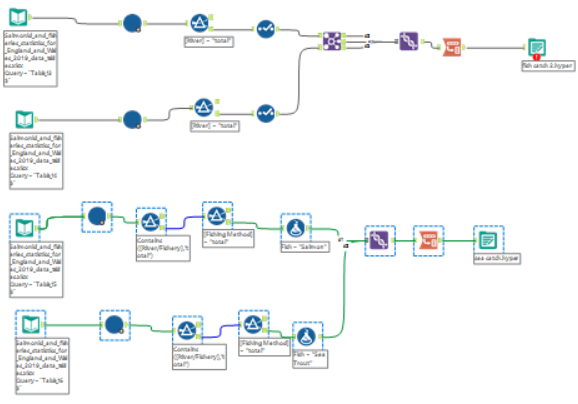
The data needed a bit of cleaning and reshaping so I brought it into Alteryx and found that although each table was different the same logic could be applied to cleaning them so I built a macro to make my life easier and I hadn't built a macro in a while so wanted to test what I could remember.

After a few multirows and dynamic rename I was mostly there and just had to bring the data together.

At this point I decided I was going to find Spatial data for the rivers I spent ages doing this and realised that time was quickly slipping away so I thought it'd be best to build a dashboard with what I had and if I had time I would go back and try and find more data to supplement my design.
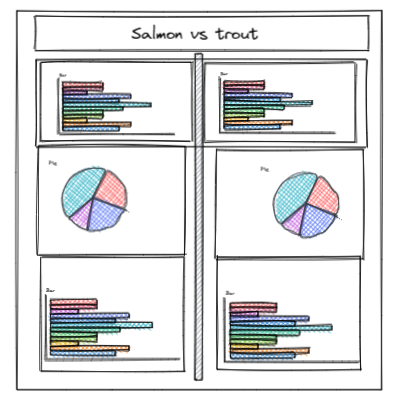
So I hopped back into Excalidraw to quickly rethink my design.

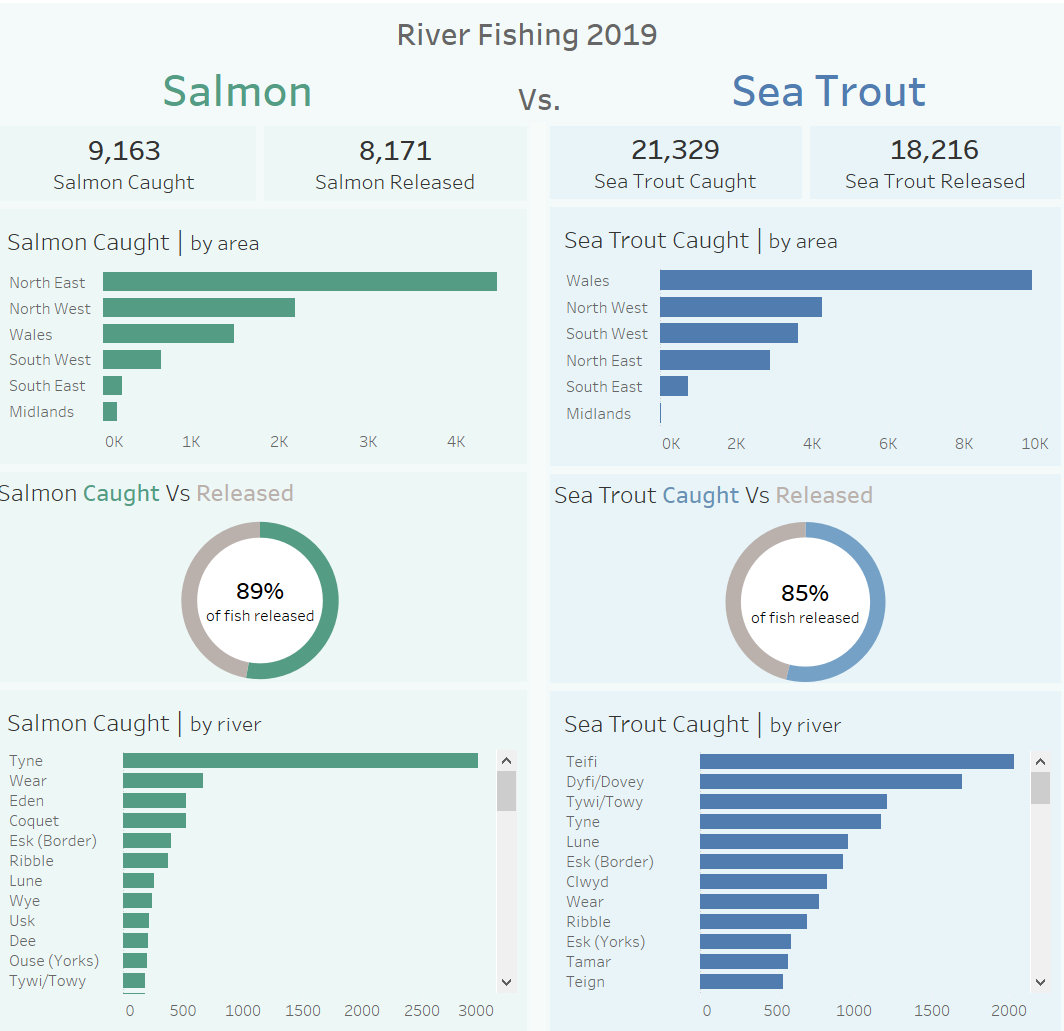
I wanted to compare the two different types of fish so I opted for showing them side by side to make this easier.
Now it was time to build the dashboard!

