


In this example, a linear regression tool has been used in Alteryx to predict urban population of a country using different HDI indicators.
The output report looks like this:
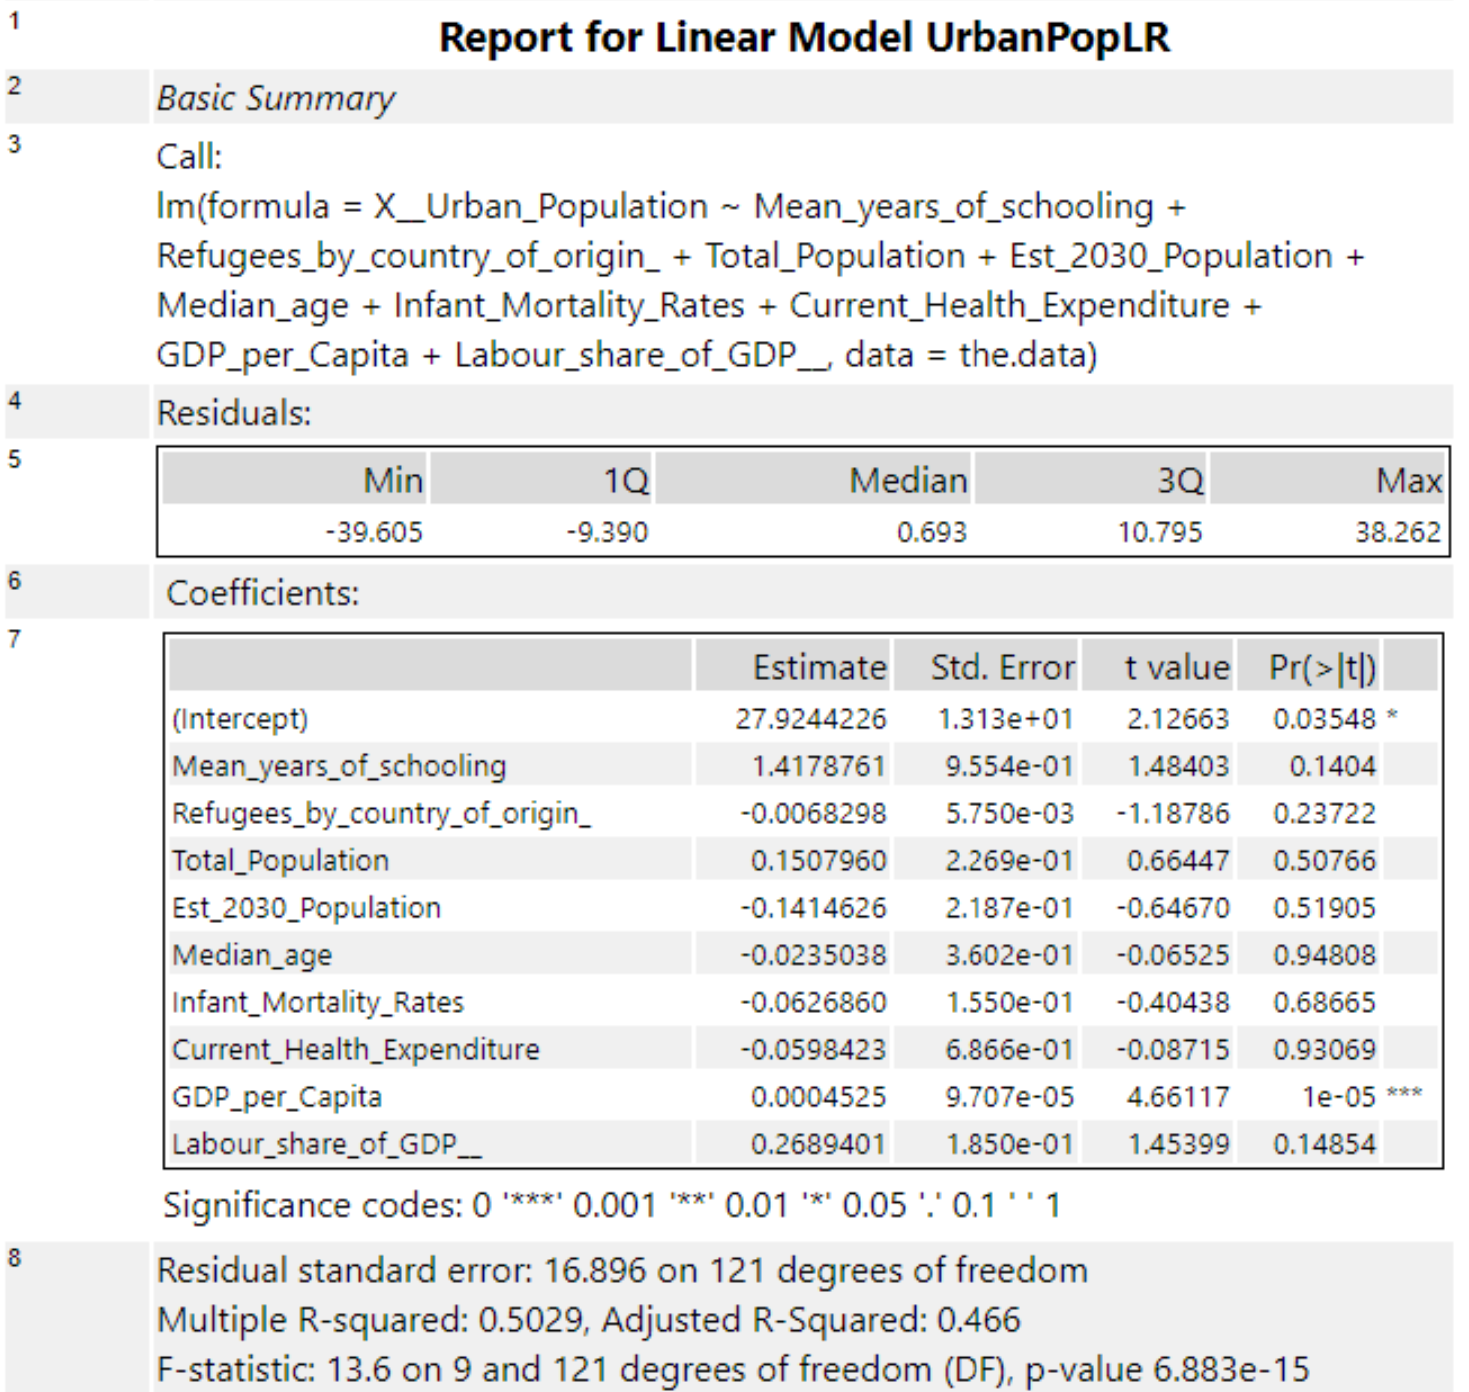
The resulting prediction of urban population is a linear function of the independent variables shown in the call.
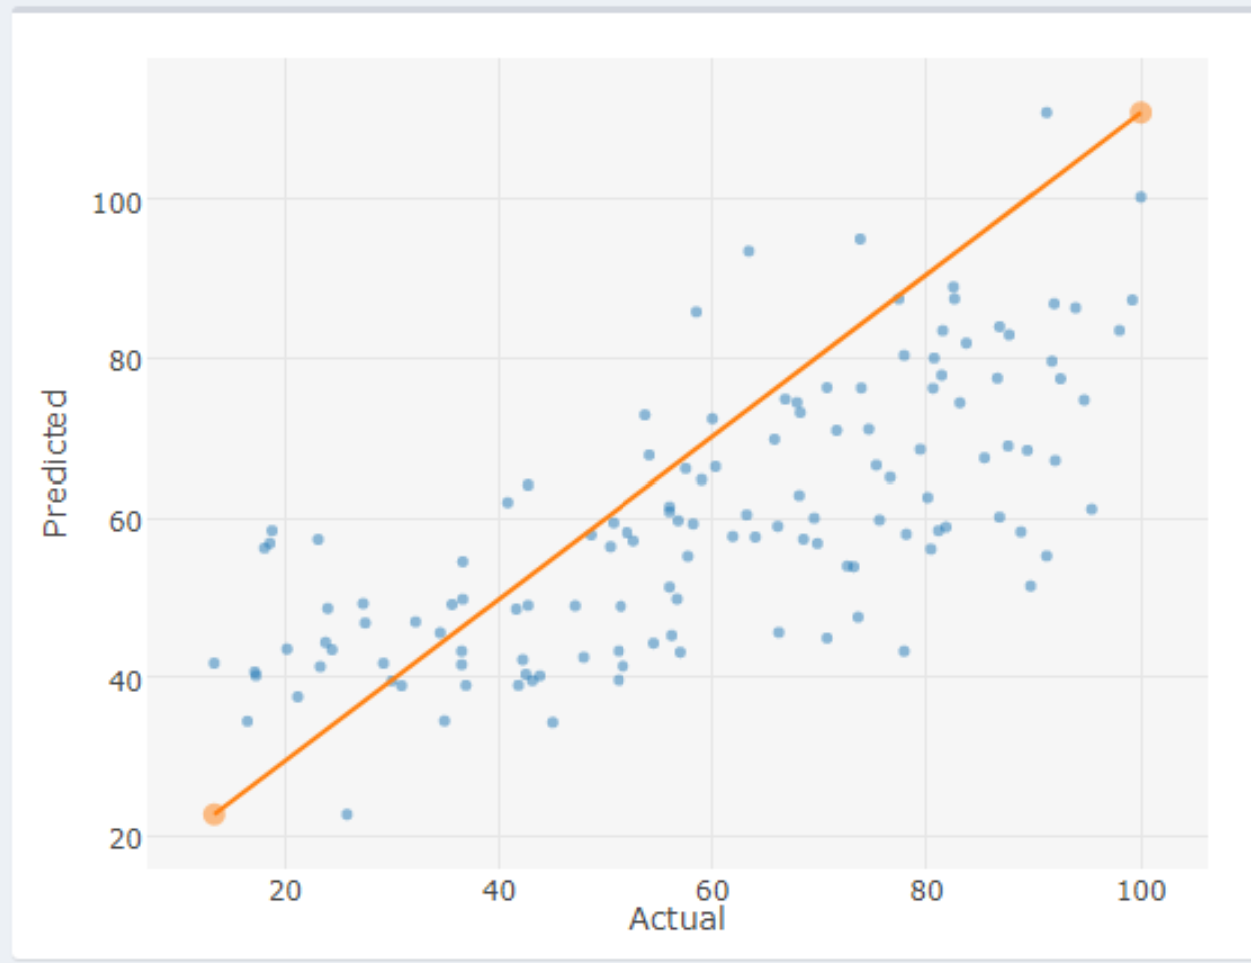
The residuals are the differences between the actual urban population of each country and the urban population predicted by the model. In the chart below, they would be the distances between the points (actual values) and the predicted line.
The coefficients essentially describe the relationship between the predicted value and the independent variables. In a more technical sense, the estimate shows by how much the urban population is predicted to change if the independent variable increases by one unit. For example, if the mean years of schooling rose by one year, the urban population is estimated to rise by 1.4 million (always remember in what units the dependent variable is measured in).
The p-values test the hypothesis that the coefficient is equal to zero (i.e. the variable has no effect on the dependent). A small P-value means that the independent variable is statistically significant, a large p-value means that you cannot reject the hypothesis of the coefficient equaling zero.
The R-squared and adjusted R-squared represent how well the model explains the data i.e. what percentage of the data is explained by the model. A higher R-squared means the model fits better, but be careful – a very high R-squared simply means the model performs well with the data you are using – it does not necessarily mean the model will perform well if you feed it new data.