


In this example, we’ll be making KPI’s for each region, showing total sales in the most recent year, and a percentage comparison to the previous year.
First we create a table of sales by region and year of order date, using the Sample Superstore dataset.
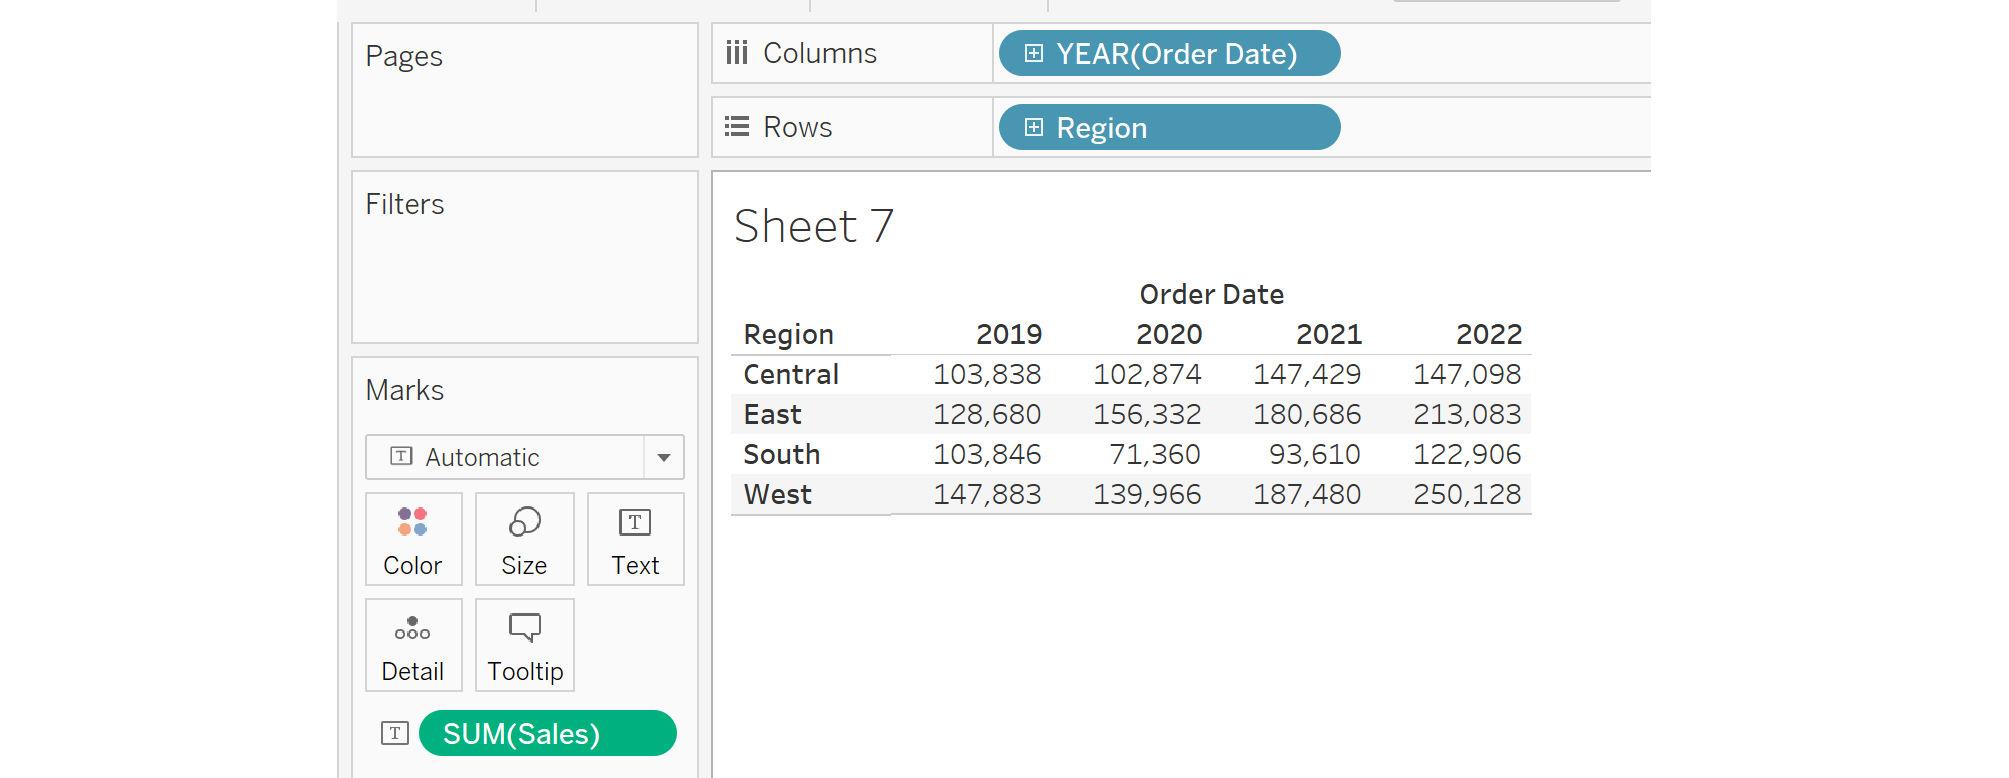
Next, right-click on the SUM(Sales) in the marks card and click Add Table Calculation.
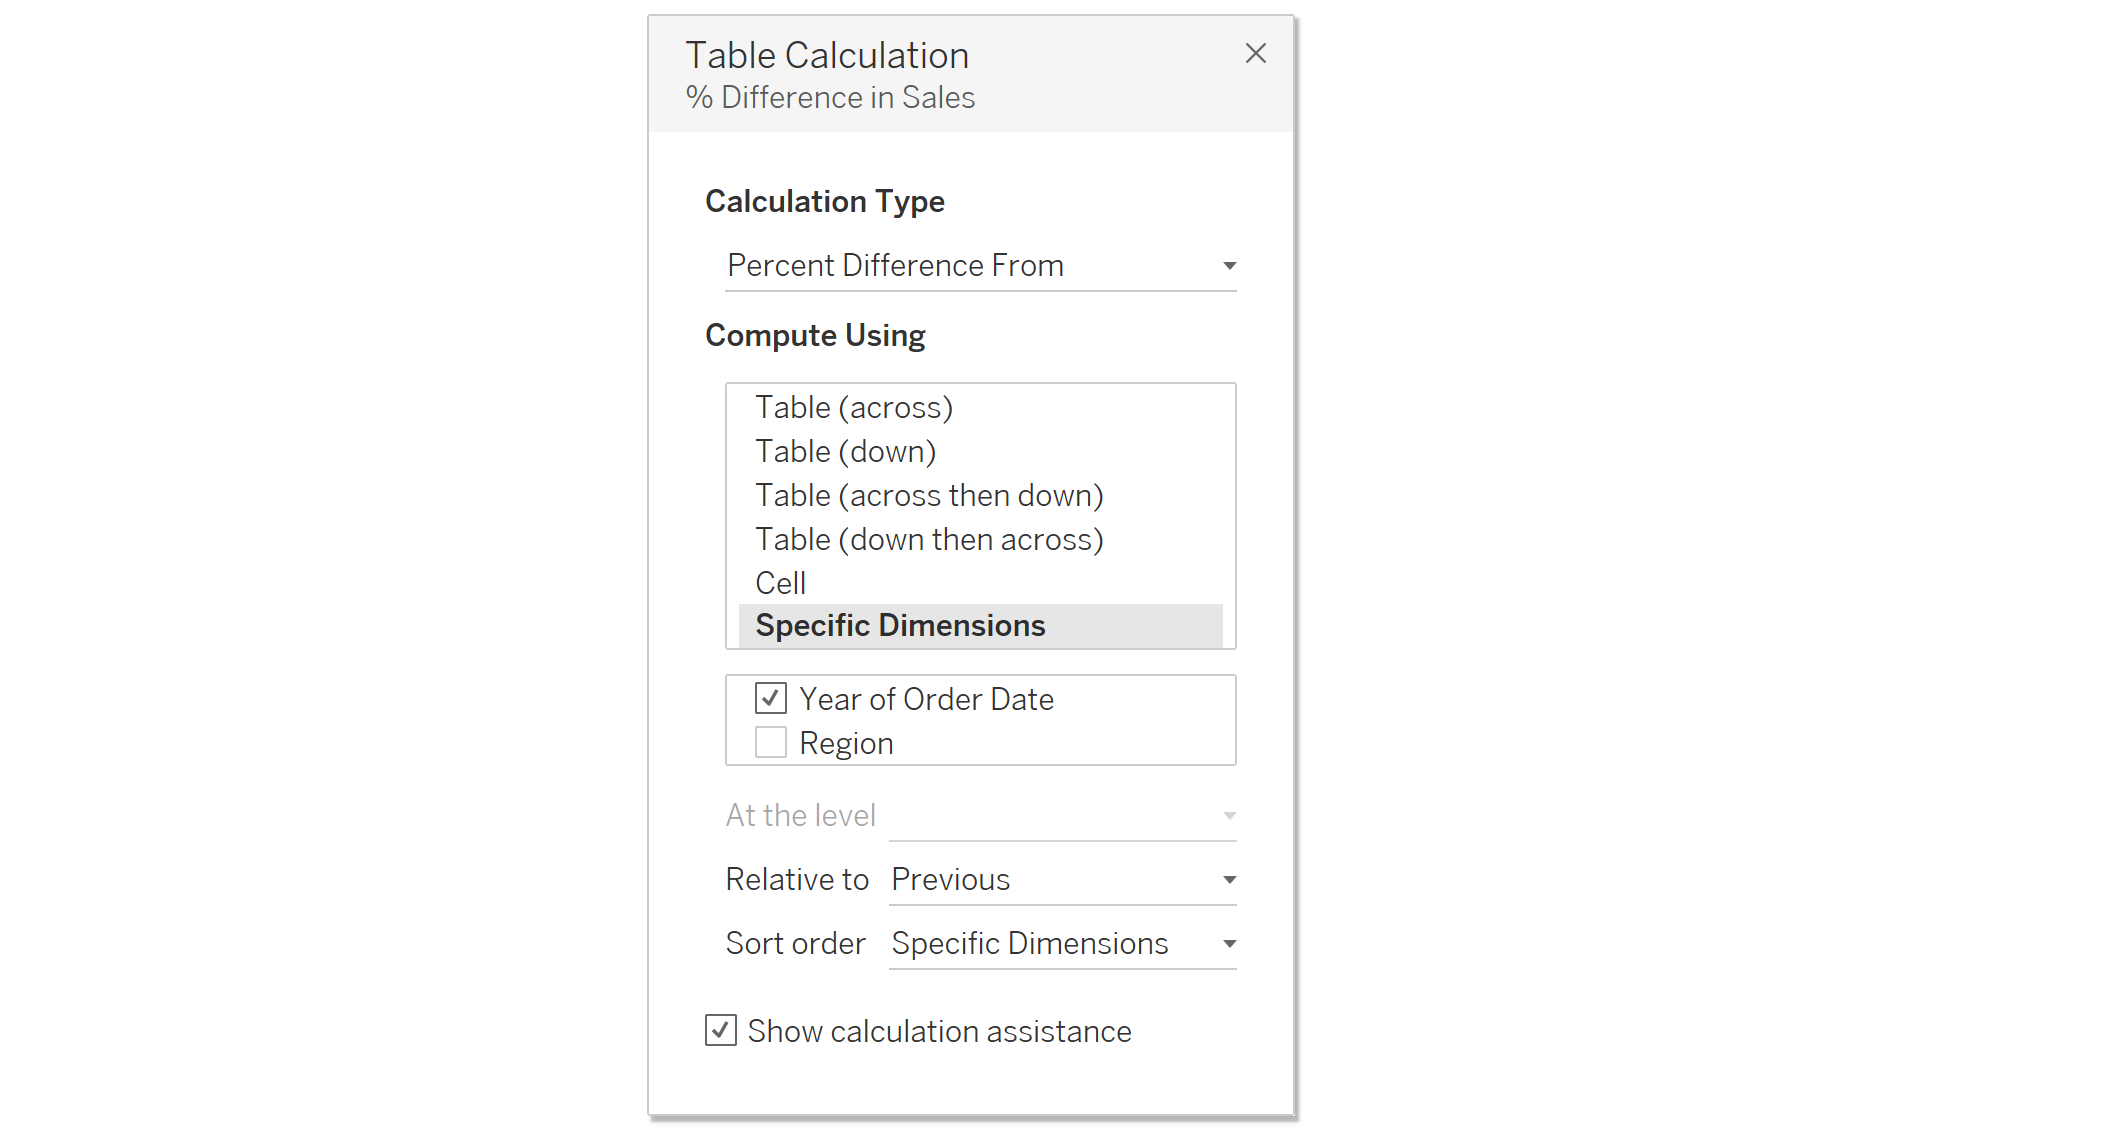
Configure the calculation as below. Make sure Year of Order Date is selected and Region is deselected, so it calculates the percent difference across the dates, resetting for every region.
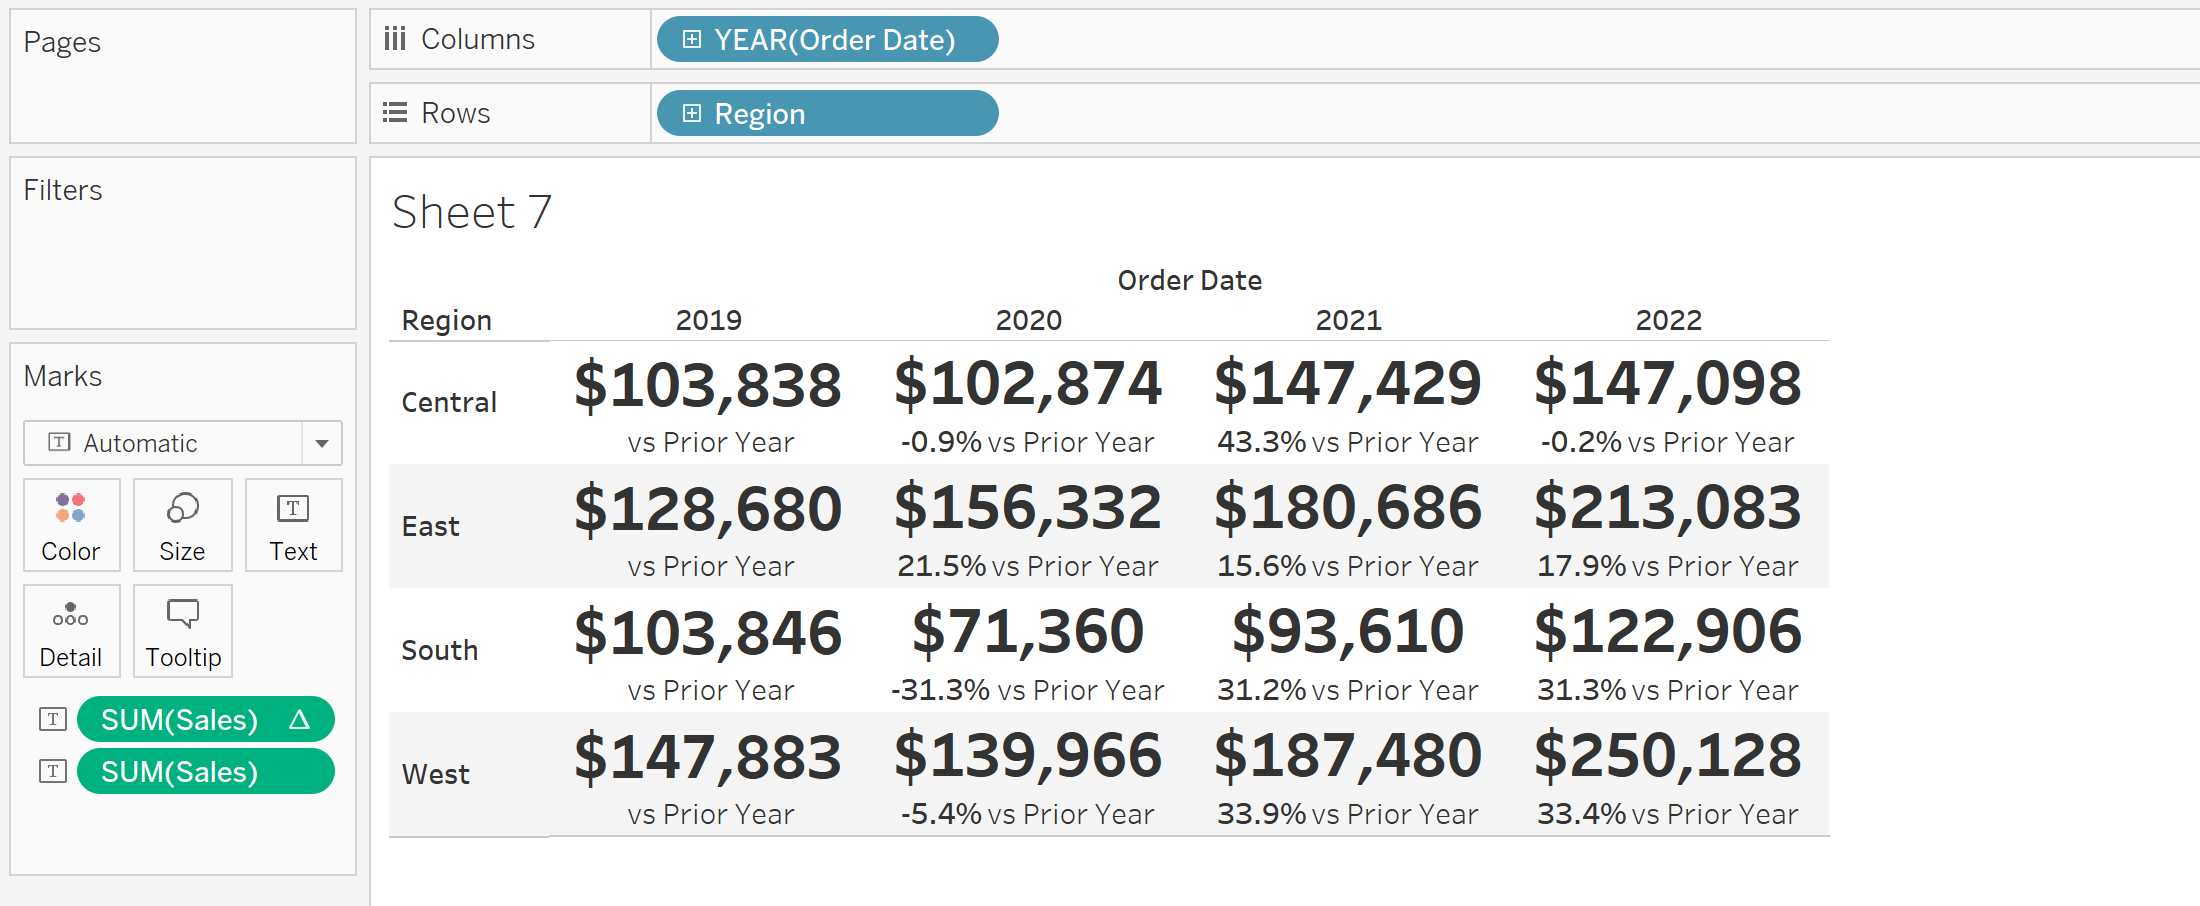
Then add SUM(Sales) to the Text marks card again to have the total sales for each region and year. Format the KPI’s.
Now for a little magic trick ✨. Create a calculated field using the last function – this will be used to filter the chart so that only the latest year is shown.

Essentially, the last() function assigns the value 0 to the last element in the view, the value 1 to the previous element and so on. You can configure how it determines which pane is last by changing the function’s computation. First put the calculated field in the filters pane and set it to true, then right-click the Last Filter and edit the table calculation as follows:
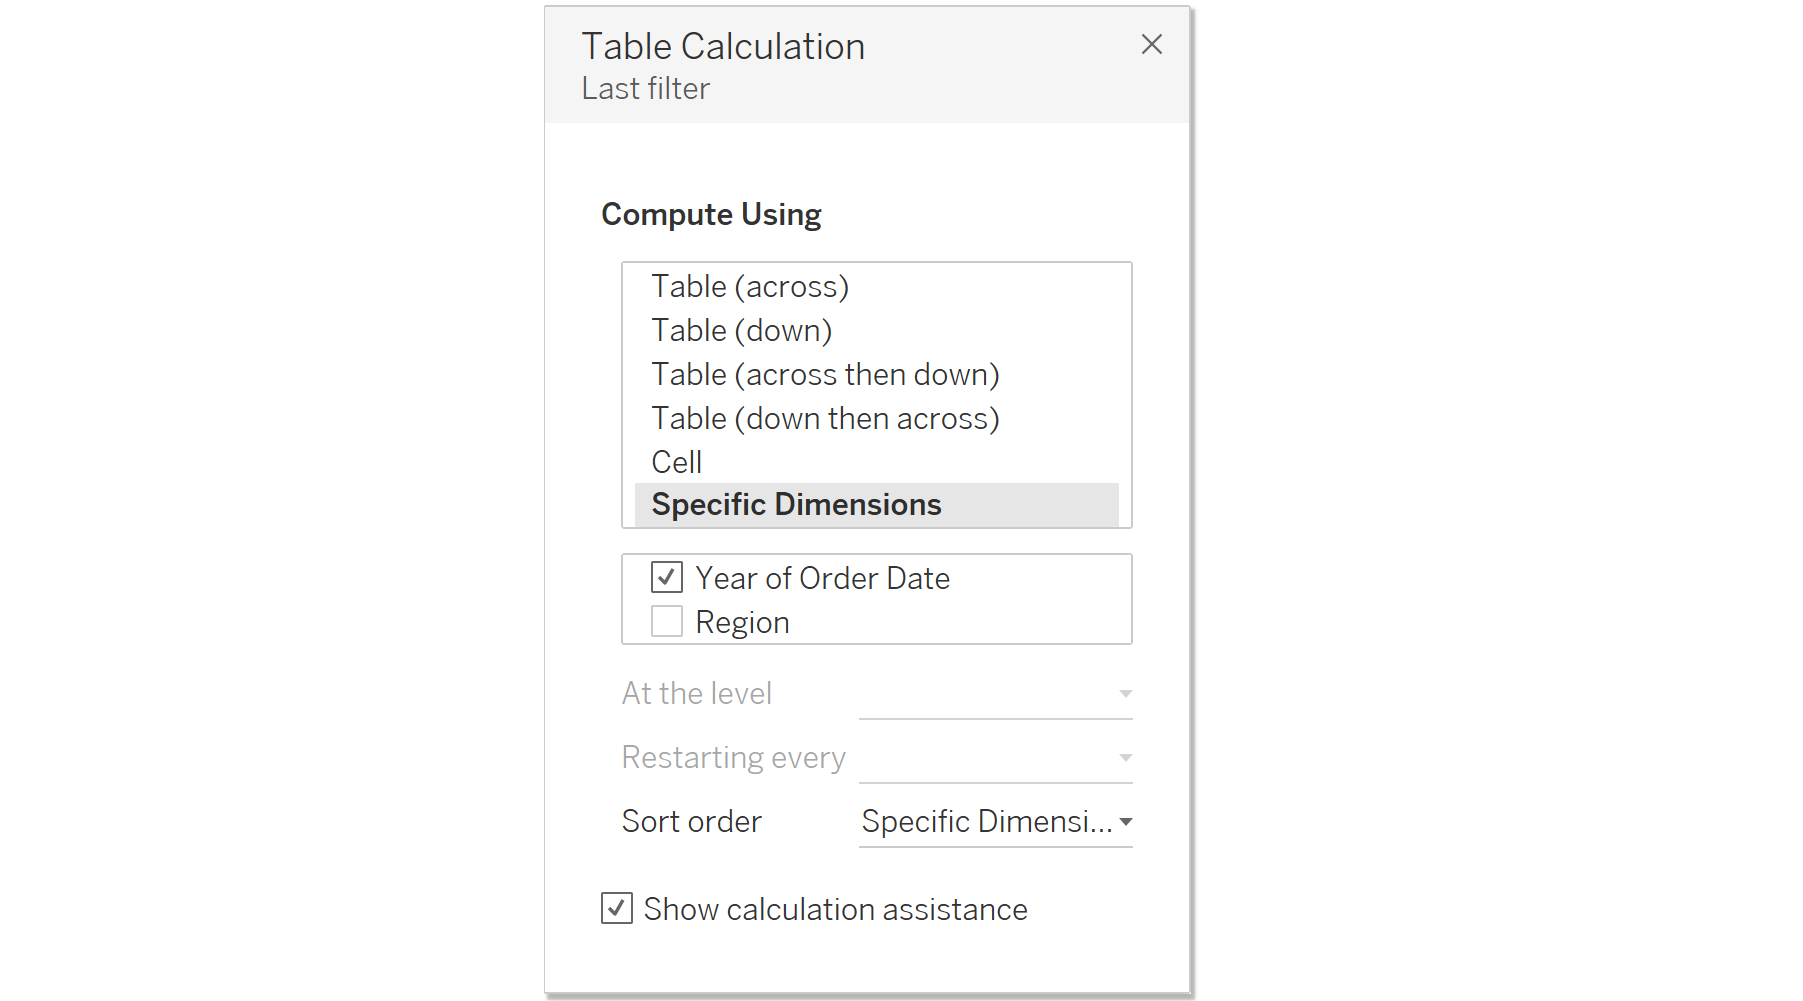
This way, for every region the last() function will assign zero to the latest year (i.e. the year that appears last in the view). Since we set the filter calculation to zero, anything not assigned 0 by the last() function will be filtered out, so only the latest year is shown for every region. After editing the calculation, you'll need to set the filter to True again.
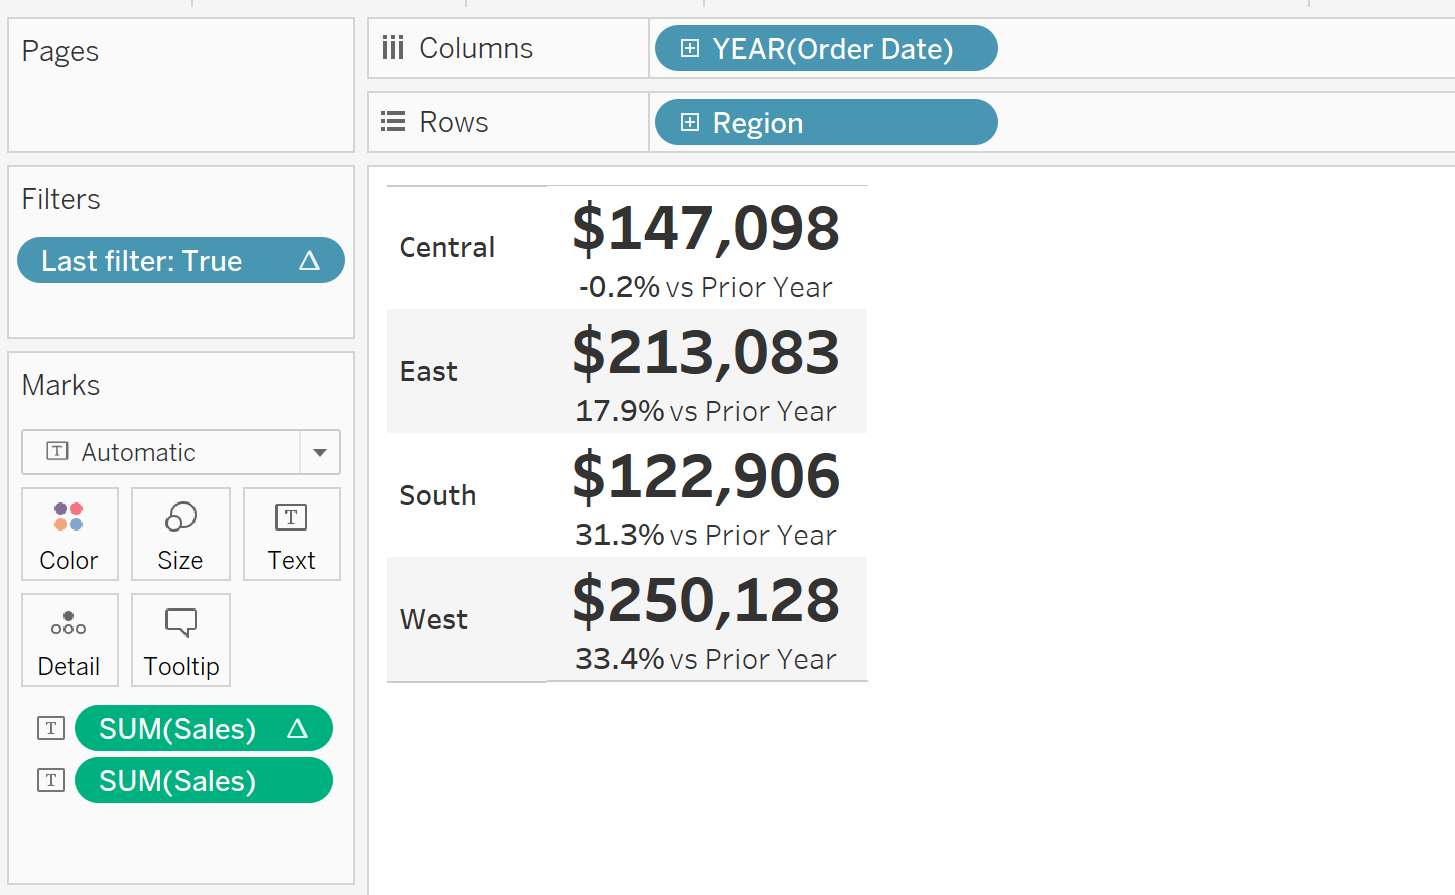
Hide the headers and you now have your KPI’s for each region. This chart is dynamic – if the data updates to 2023, 2023 will now be the last year in the view and 2022 will be hidden along with the rest of the years. Doing it this way also means the percent difference calculations will still work, even if the prior year is not visible in the view.
In part 2, I will demonstrate how you can build the same chart using table calcs again, but by creating dynamic fields for the current and prior year sales.