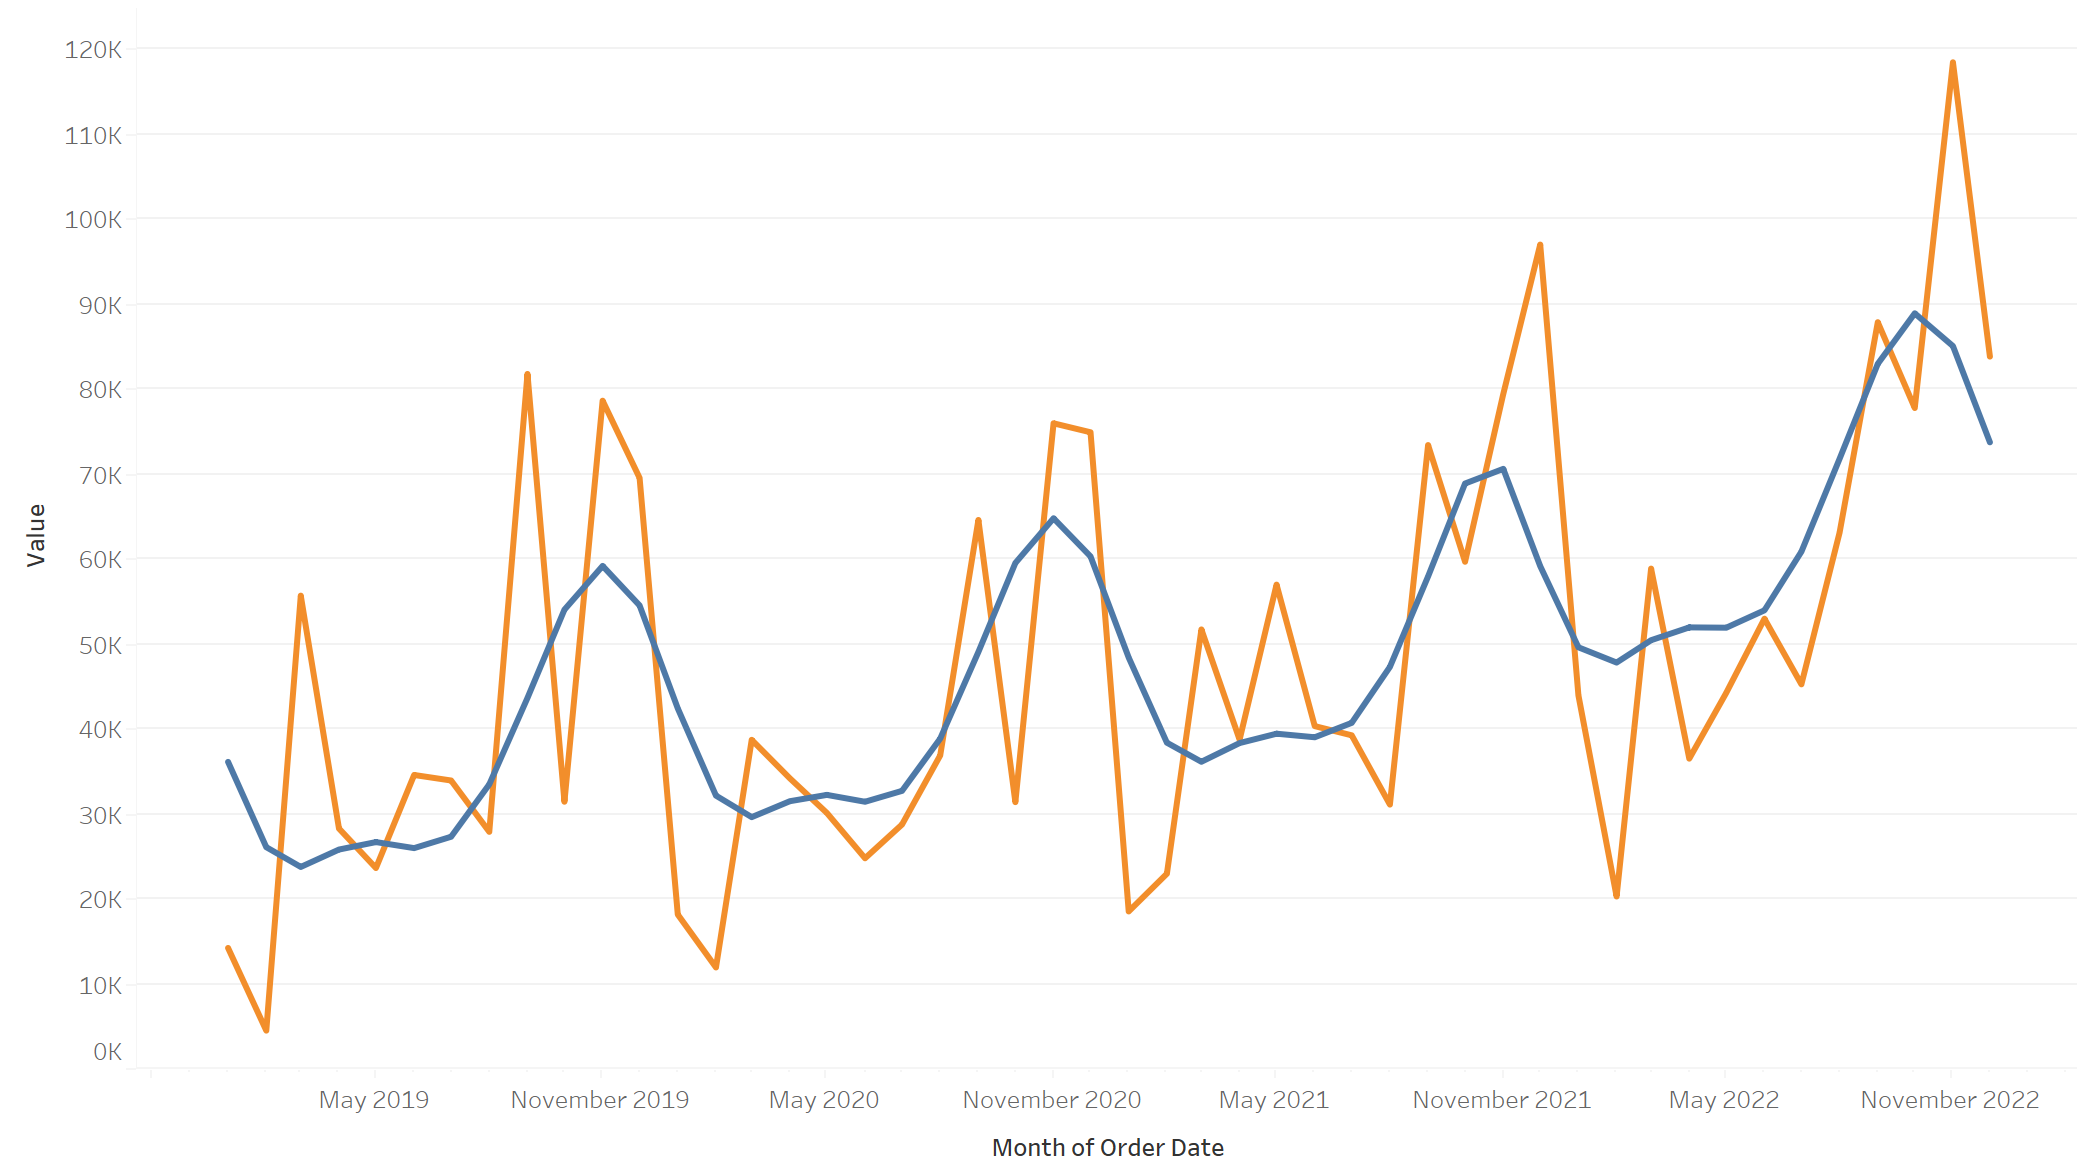
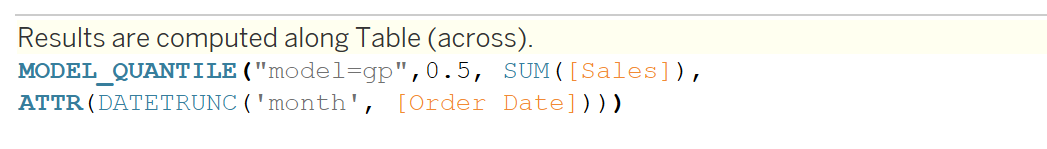
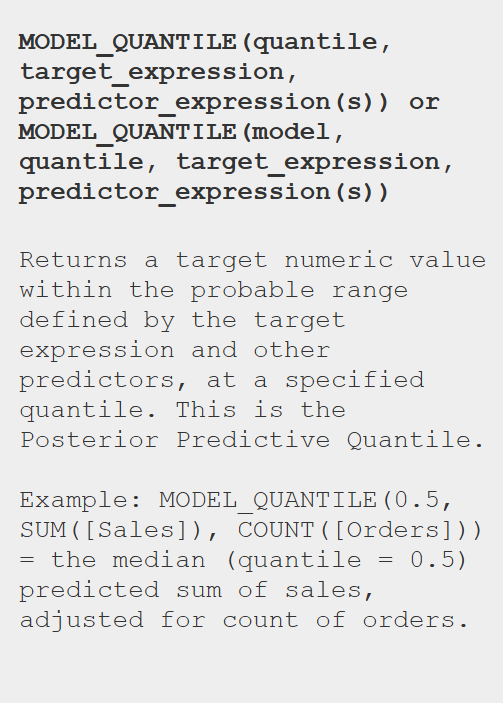
Tableau is capable of generating predictive models with relative ease, you only need to know which type of model you want to create; it is possible to create Linear Regression, Regularized Linear Regression and Gaussian Process Regression. We will be using the MODEL_QUANTILE function in Tableau to generate these models, this will return a value which has been calculated using the desired quartile ranges (0>V<1).
Each of these models has their own benefits and limitations; Linear Regression is best used when you have only one predictor and it is independant to your target metric.

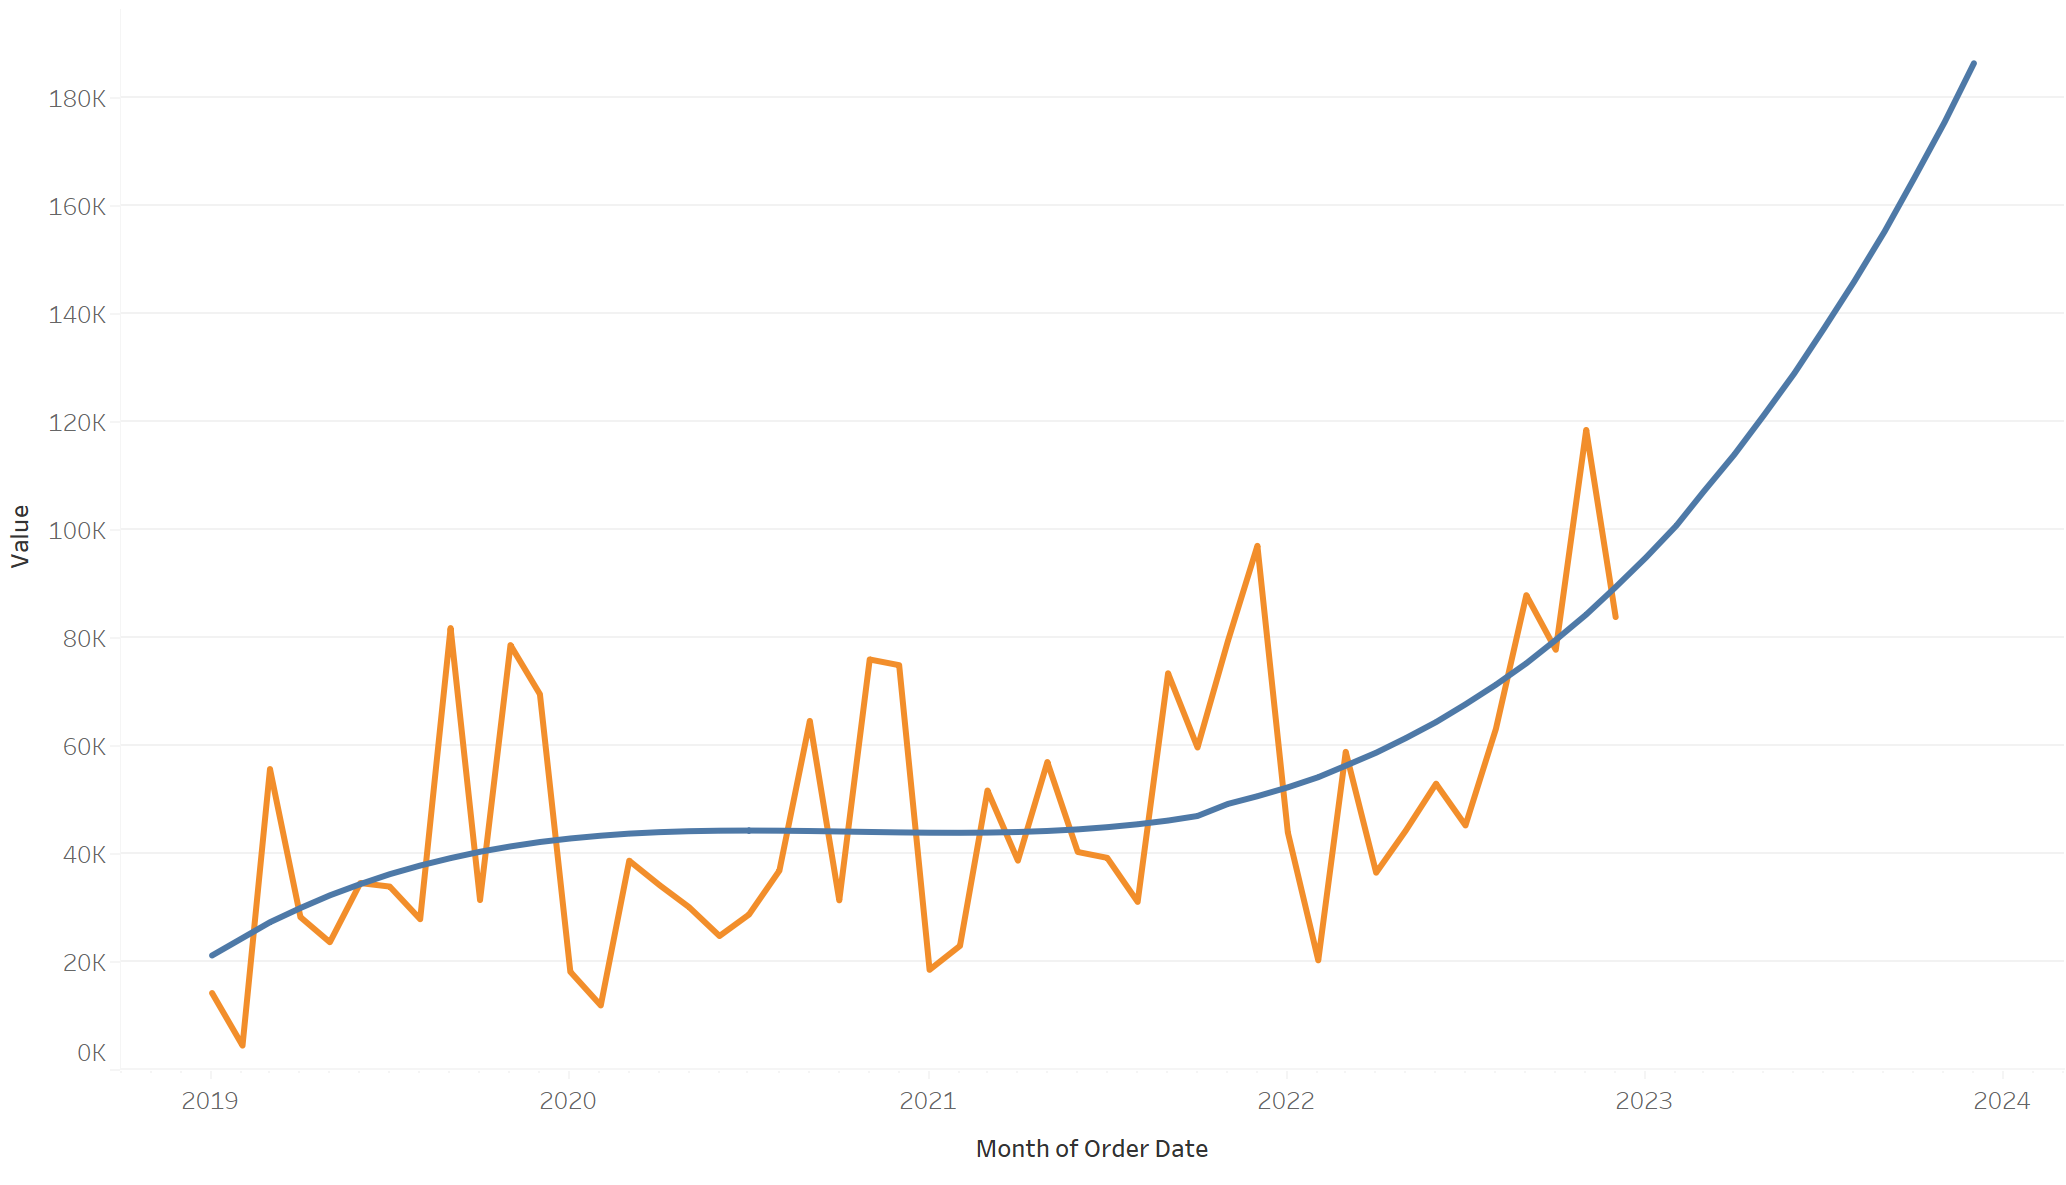
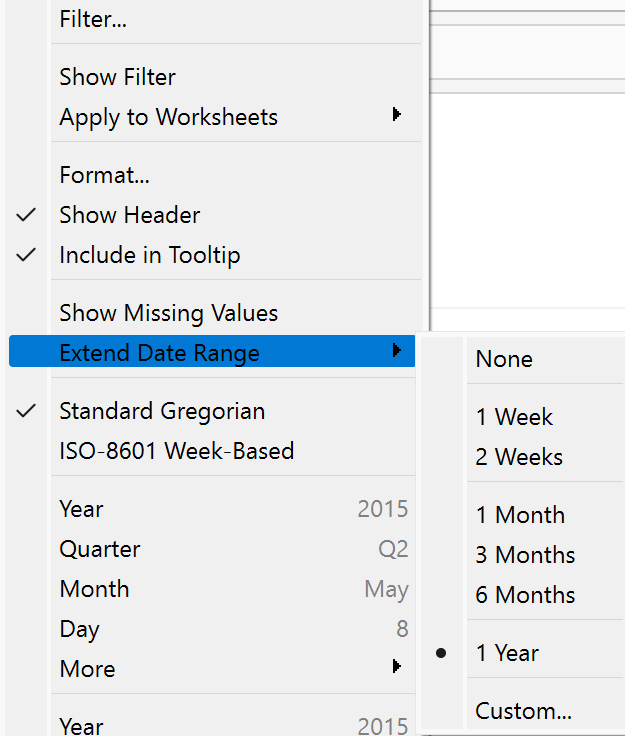
Currently the model extends 1 year into the future, generating the values based on those which have preceded it, although not immensely in-depth, the values can be useful to give an indication to a possible trends in the near future. It is also possible to change how far in the future the values are generated for, Simply right-click on your "Time" field in the rows or columns and select Extend Date Range.
Regularized Linear Regression is similar to Linear Regression, however, is best used when you have two or more variables and there is a linear relationship between them, which is know as colinneariality.

Finally, there is Gaussian Process Regression which is best used when there is a continuous dimension such as time, or when there is a nonlinear relationship between the variable and prediction target. The dimension used must be an ordered dimension such as Months in a Year, or multiple unordered dimensions.