Time Series is set of predictive tools on Alteryx which can be used to forecast data values in the future, what sets these tools apart from the normal predictive tools is the element of time.

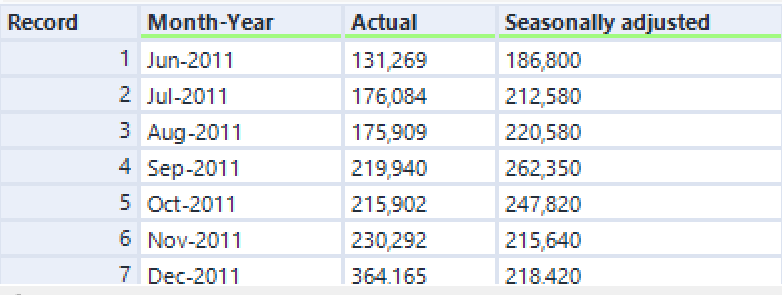
To start using these tools, you will first need a number of date/time values in addition to values which correspond to these. An example of this could be the number of visitors New Zealand receives in any given month.
ARIMA and ETS are the 2 main tools used for Time Series models and are not too dissimilar in the results in which they produce.
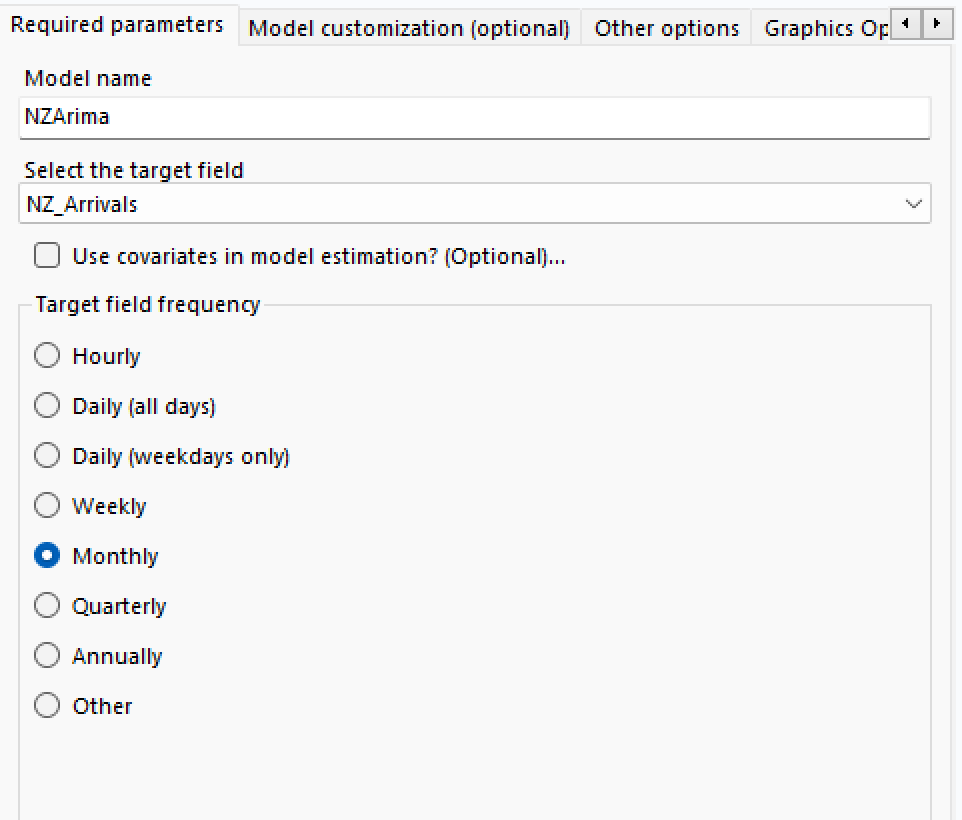
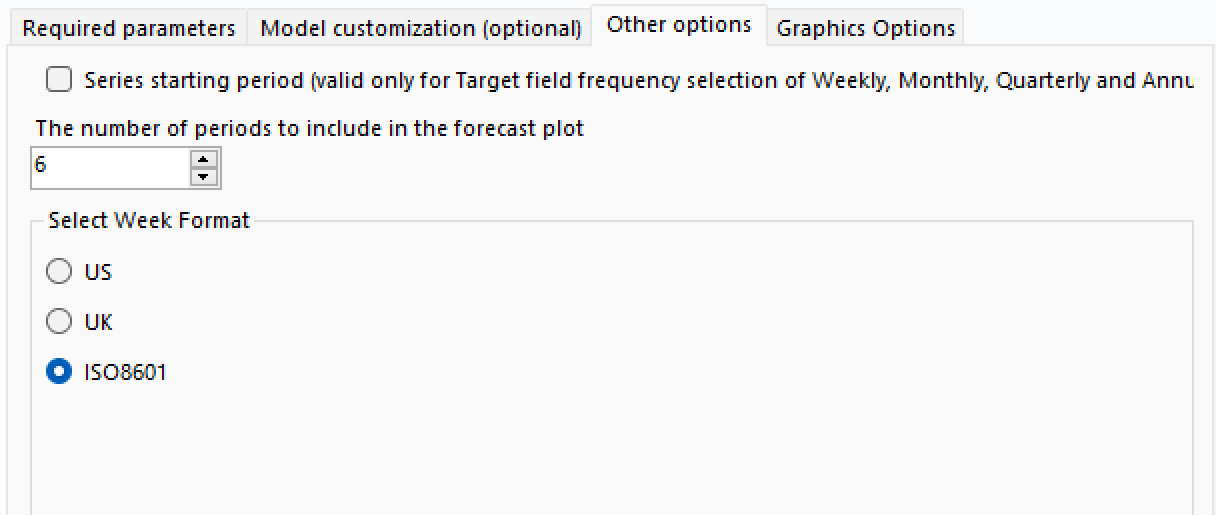
After selecting the frequency of your data set, you will need to choose the number of frequencies you wish to predict e.g. if you selected Months as the field frequency and set the number of periods to 6, the model will predict the values for the next 6 months.
The outputs are where the differences are between the tools, both of them return the values with the forecasted values set in the configuration.
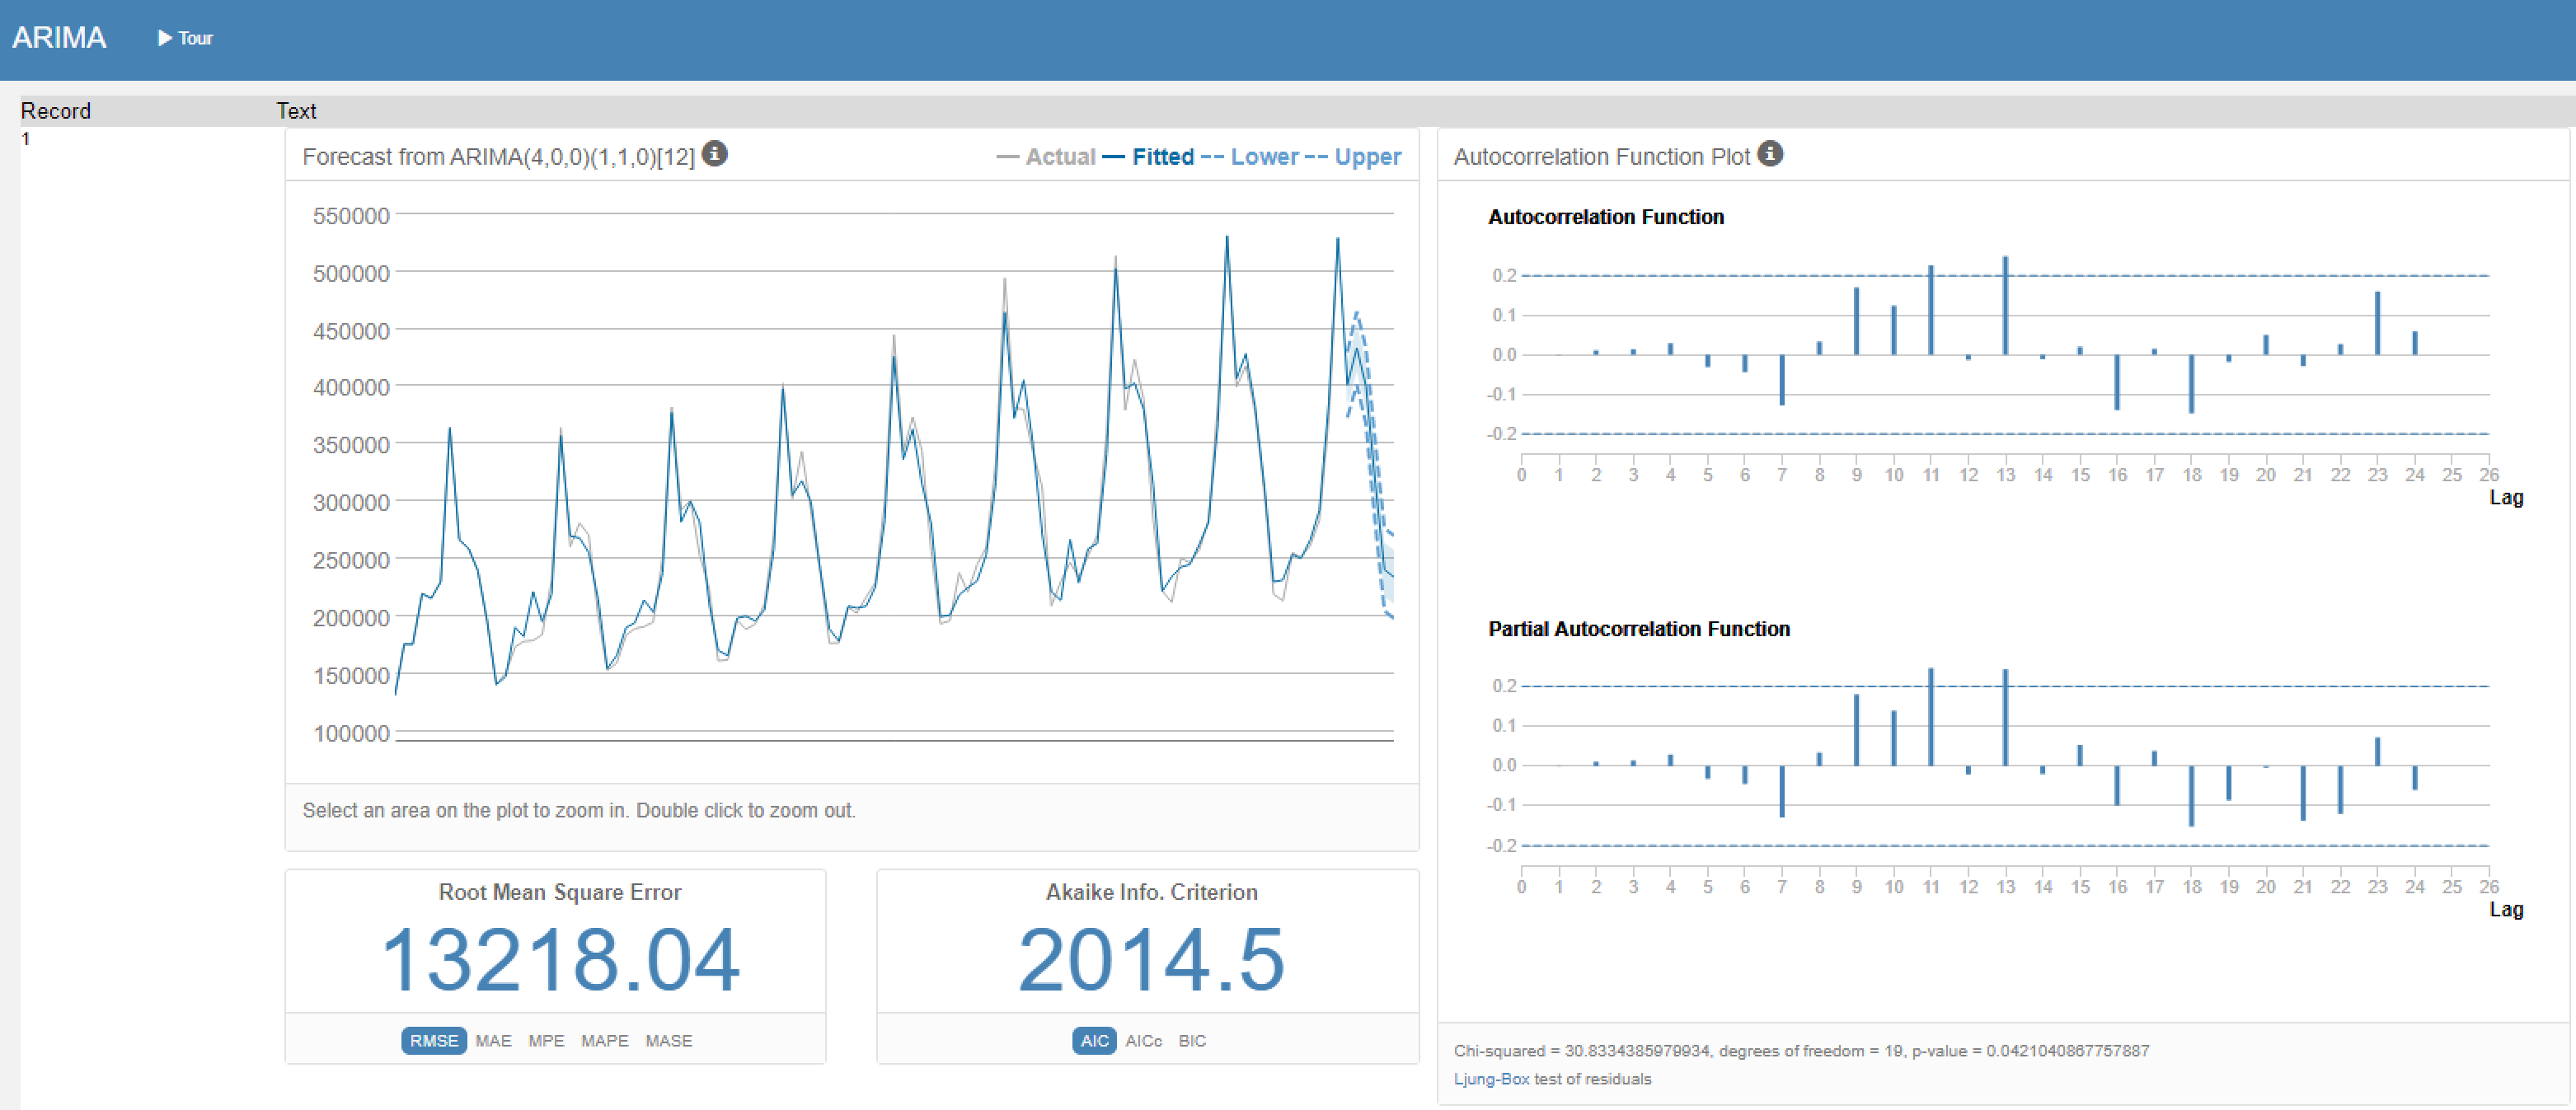
ARIMA provides 3 charts in the results pane, the first chart shows the actual values, with an overlay on top showing the fitted values and uses a dotted line for the forecasted values with shaded areas showing the upper and lower values of the prediction. The other 2 charts show the values of the autocorrelation which has taken place.
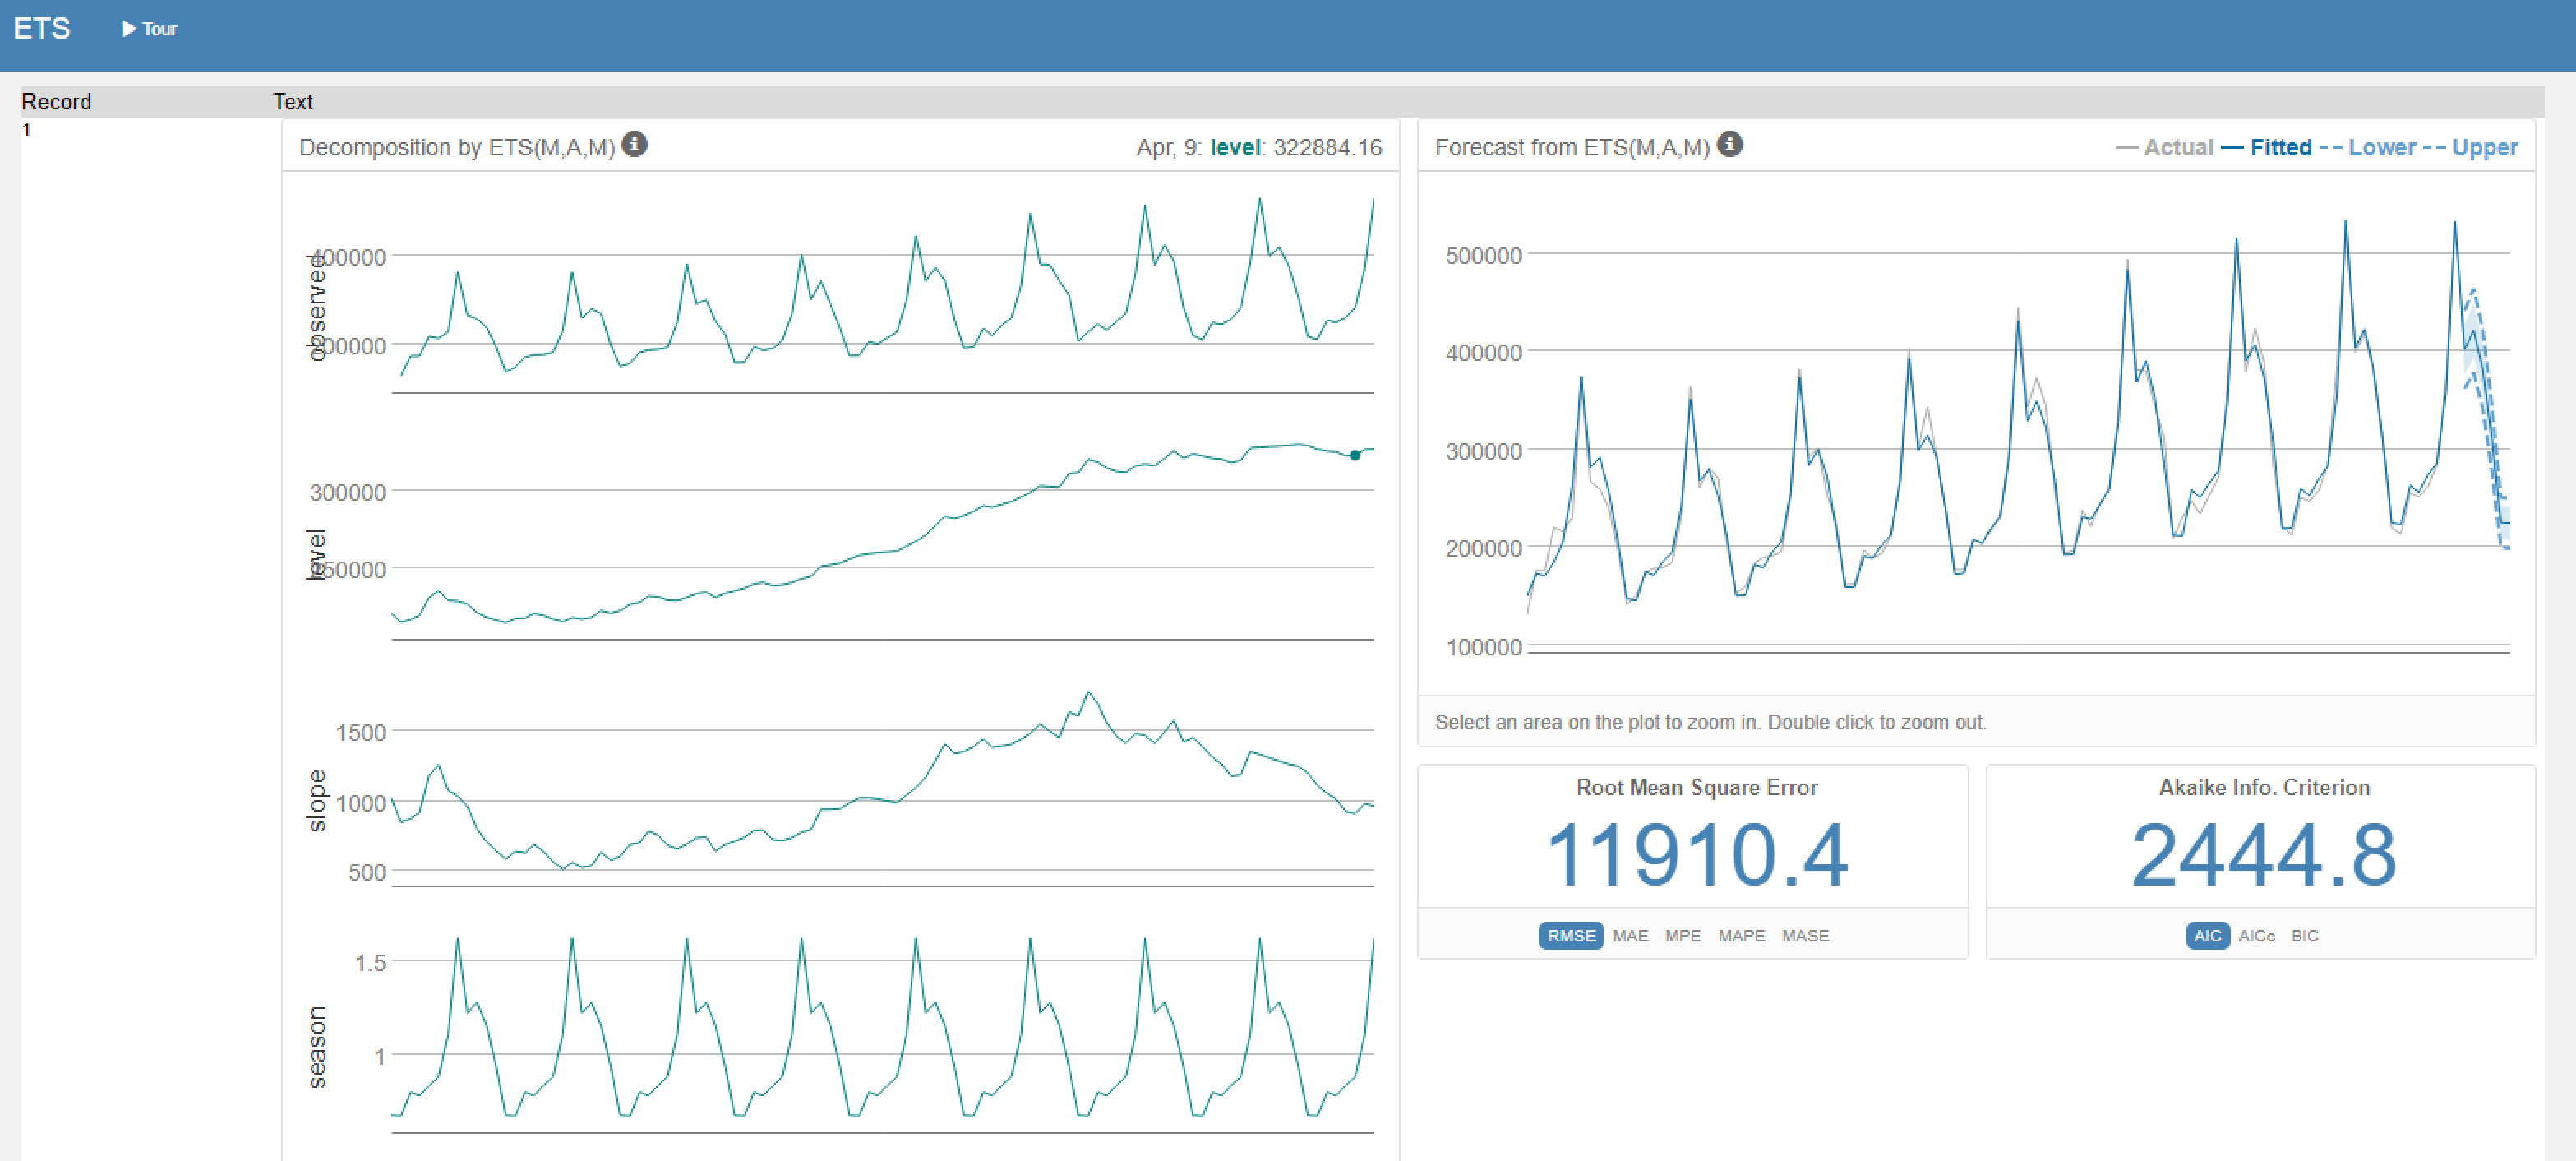
ETS shows a similar forecasting on the larger chart but the smaller charts are there to demonstrate the composition of the chart on the right and is broken down to show the trend, seasonality, slope and level.
