


When working in Tableau, you will often hear the term LOD or Level of Detail.
LOD expressions are very useful tools for analysing data, and are often found to be very confusing concepts.
But What is Level of Detail?
In Tableau, calculations normally depend on the dimensions in your view. For example, if your visualisation contains region then tableau will calculate metrics such as sales per region.
If your view contains region and category then tableau will calculate sales per region and per category.
The level of detail therefore changes depending on what is placed in the visualisation.
LOD expressions allow you to control the level at which a calculation is performed, regardless of what dimensions appear in the chart.
In simple terms, LOD expressions tell Tableau:
Calculate this metric at a specific level of detail.
There are three main types of LOD expressions:
- FIXED
- INCLUDE
- EXCLUDE
Each one adjusts the level of detail in a different way.
FIXED LOD
FIXED allows you to calculate a metric at a specific level, regardless of what dimensions are in the view.Example
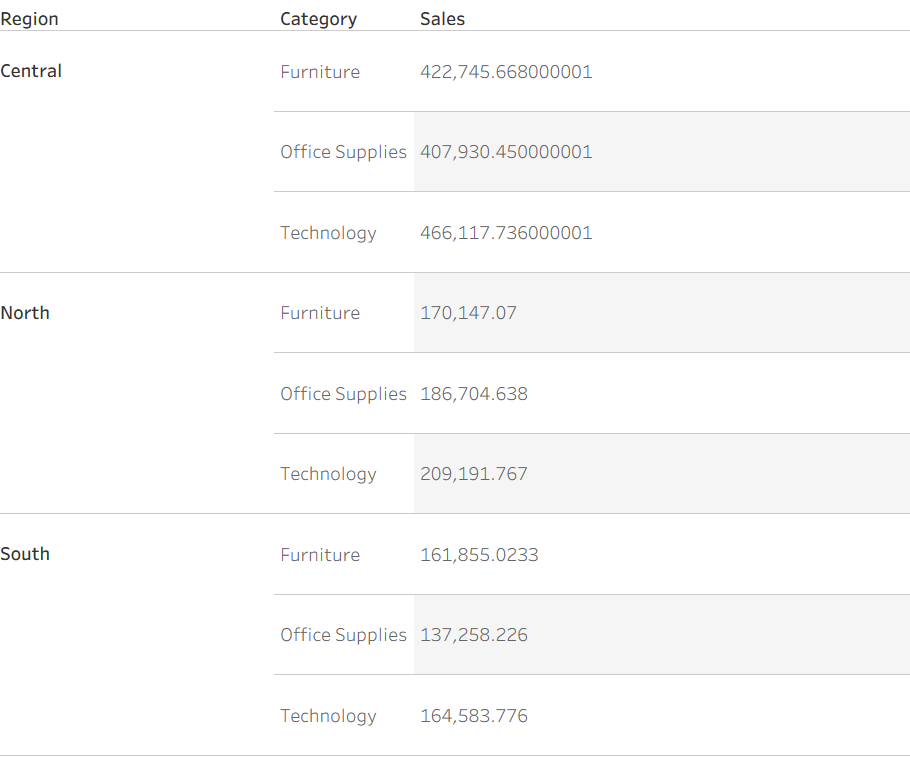
The table shows category level data:
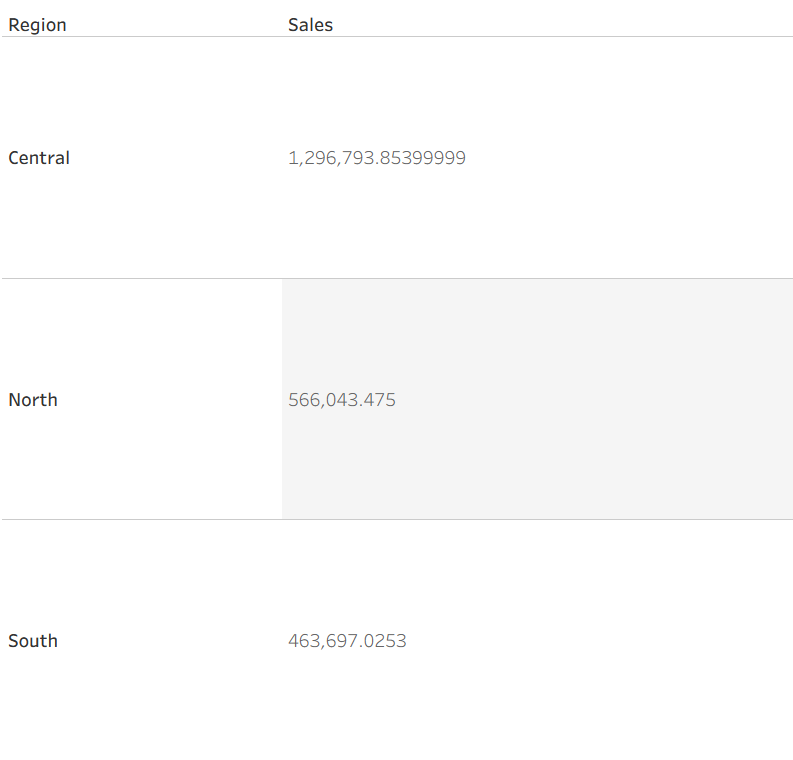
If you want to calculate total sales per region, you can use a FIXED expression.
Calculation:
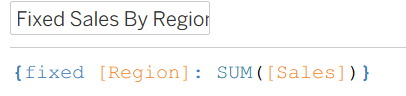
This tells Tableau:
Always calculate total sales at the region level.
The result will be:
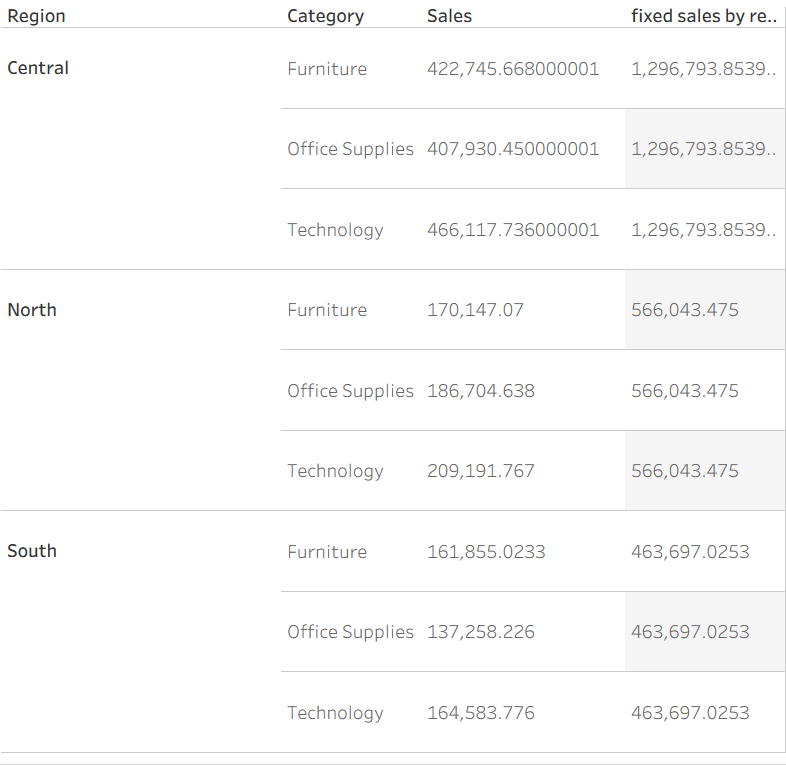
Even though the view includes customers, the calculation remains fixed at the region level.
INCLUDE LOD
INCLUDE is used when you want to add more detail to a calculation than what appears in the view.
It temporarily adds a dimension into the calculation, even if that dimension is not displayed.
Example
Imagine your dataset contains multiple orders per category:
If your view shows only region and you calculate avg. sales then tableau will calculate every row in the data set for each region.
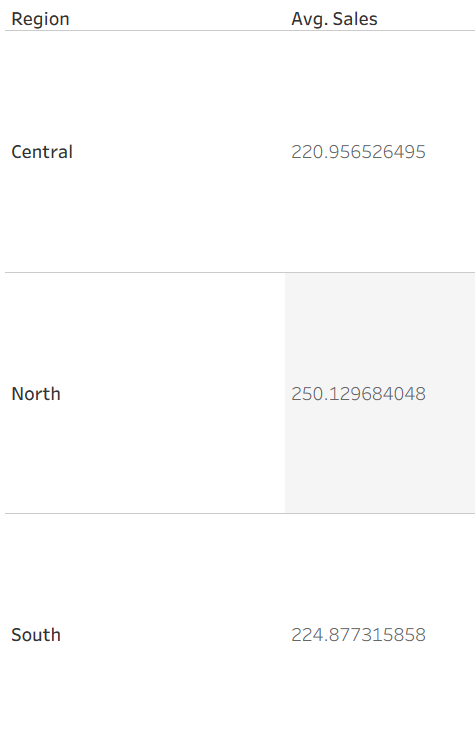
However, this is the average order of a single transaction in each region
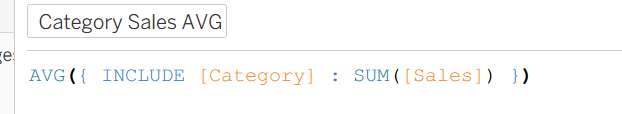
To calculate average sales per category, you can use INCLUDE.
Calculation:
Result:
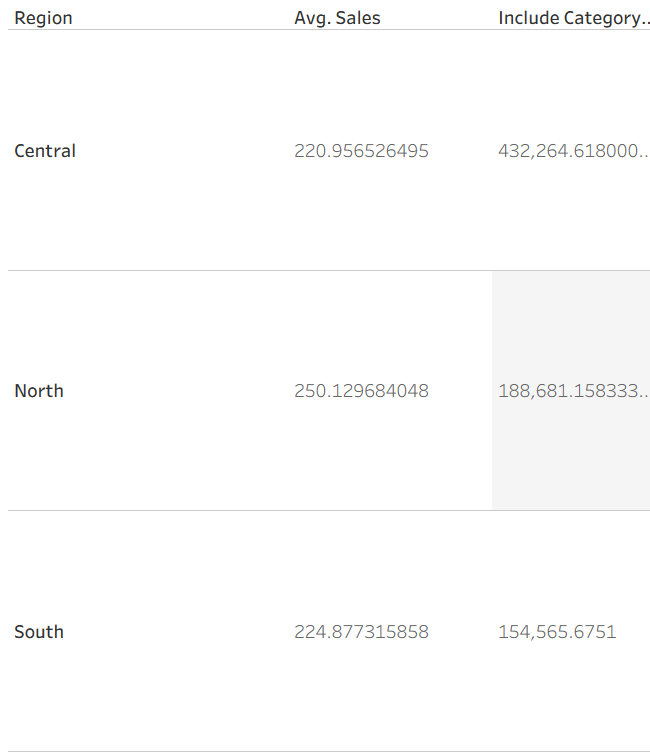
So now Tableau is calculating the average sale per category in each region.
EXCLUDE LOD
EXCLUDE does the opposite of INCLUDE. It removes a dimension from the calculation even if that dimension appears in the view.
This is commonly used when comparing individual values to totals or averages.
Example
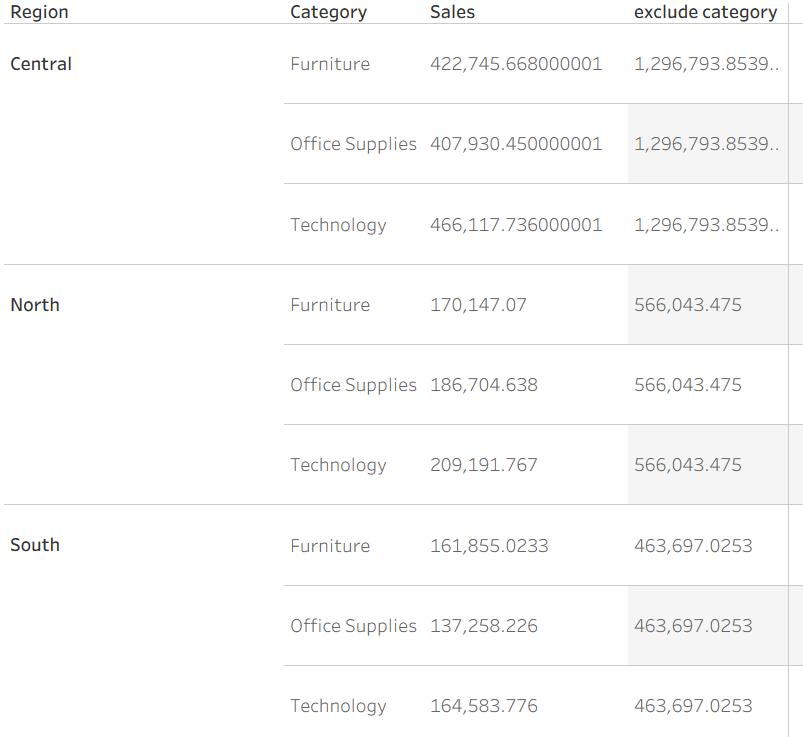
So if you have category, region and sales in the view and you want to calculate the percentage of region sales that each category contributes.
To do this you need the region total, even though the chart is at customer level.
Calculation for region sales:
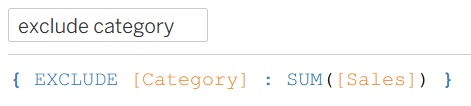
This tells Tableau to ignore the customer dimension and calculate sales at the region level ( in this example you could also do this with a fixed LOD)
The result :
Now you can calculate the percentage of regional sales by dividing the sum of sales by the exclude calc.
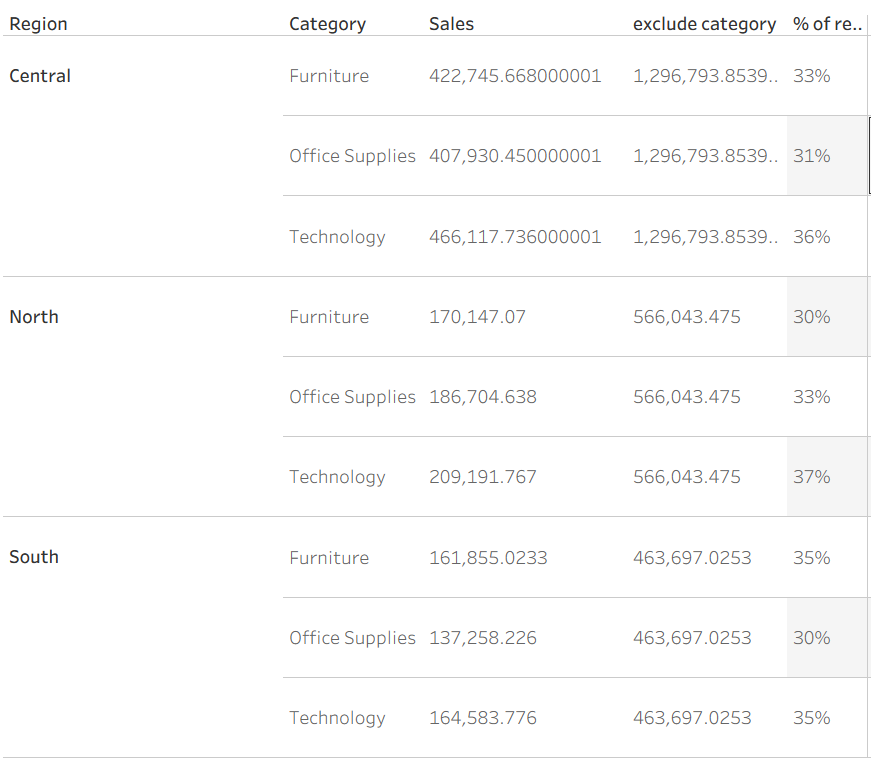
Result:
This shows the share each customer contributes to their region.
Final Thoughts
LOD expressions are powerful because they give you control over how Tableau aggregates your data.
Instead of being limited by the dimensions in a chart, you can calculate metrics at exactly the level you need.
To summarise:
- FIXED locks the level of calculation
- INCLUDE adds detail to the calculation
- EXCLUDE removes detail from the calculation
Once you understand these three concepts, you can build much more flexible and insightful analysis in Tableau.