


Makeover Monday had finally arrived, most unexpectedly on Friday. In the unlikely scenario that someone is not aware, Makeover Monday means redoing an analysis/viz in a new and better way. The goal is to explore different ways how to go about and redo an initial concept you have decided to go with after a while. More Makeover Monday examples at http://www.makeovermonday.co.uk/
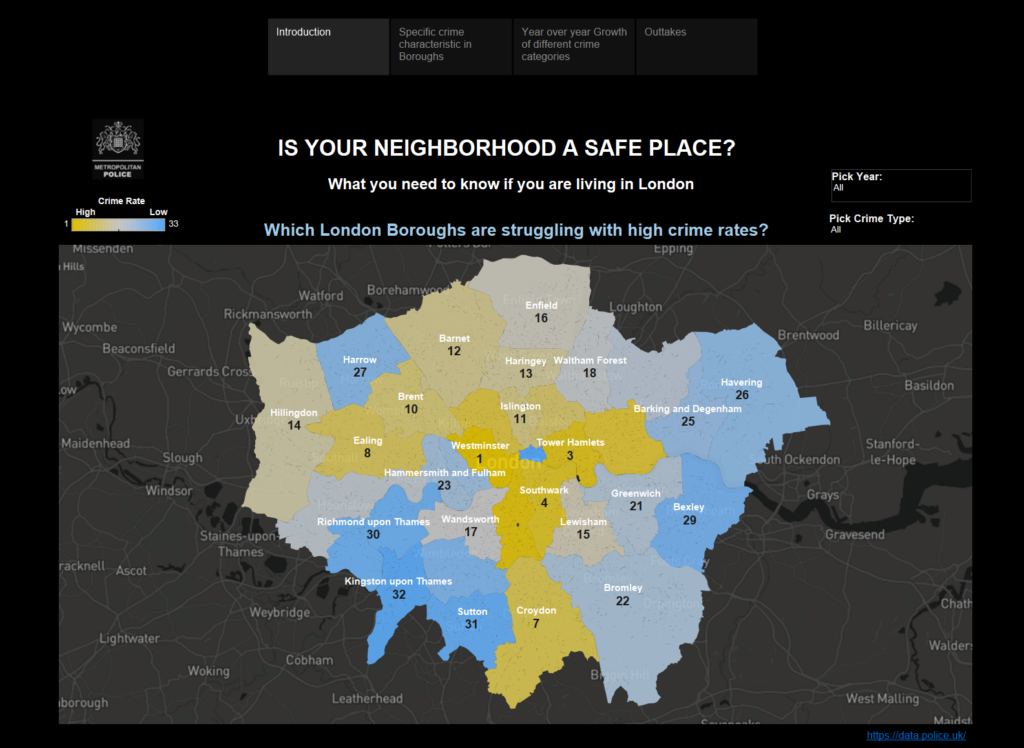
 As I’m relatively new to Tableau and don’t have that many published works I decided to go with a redo of my application for The Data School. I had done an analysis using the Metropolitan Police dataset of street crimes in the UK. Initially I had decided to focus on a smaller demographic and look at only London, making a distinction on a Borough level. The audience I aimed for was anyone who would like to see how safe their neighbourhood is, provided they live in London. Let’s go straight to what worked and what didn’t in the initial presentation, and sub sequentially what I decided to change.
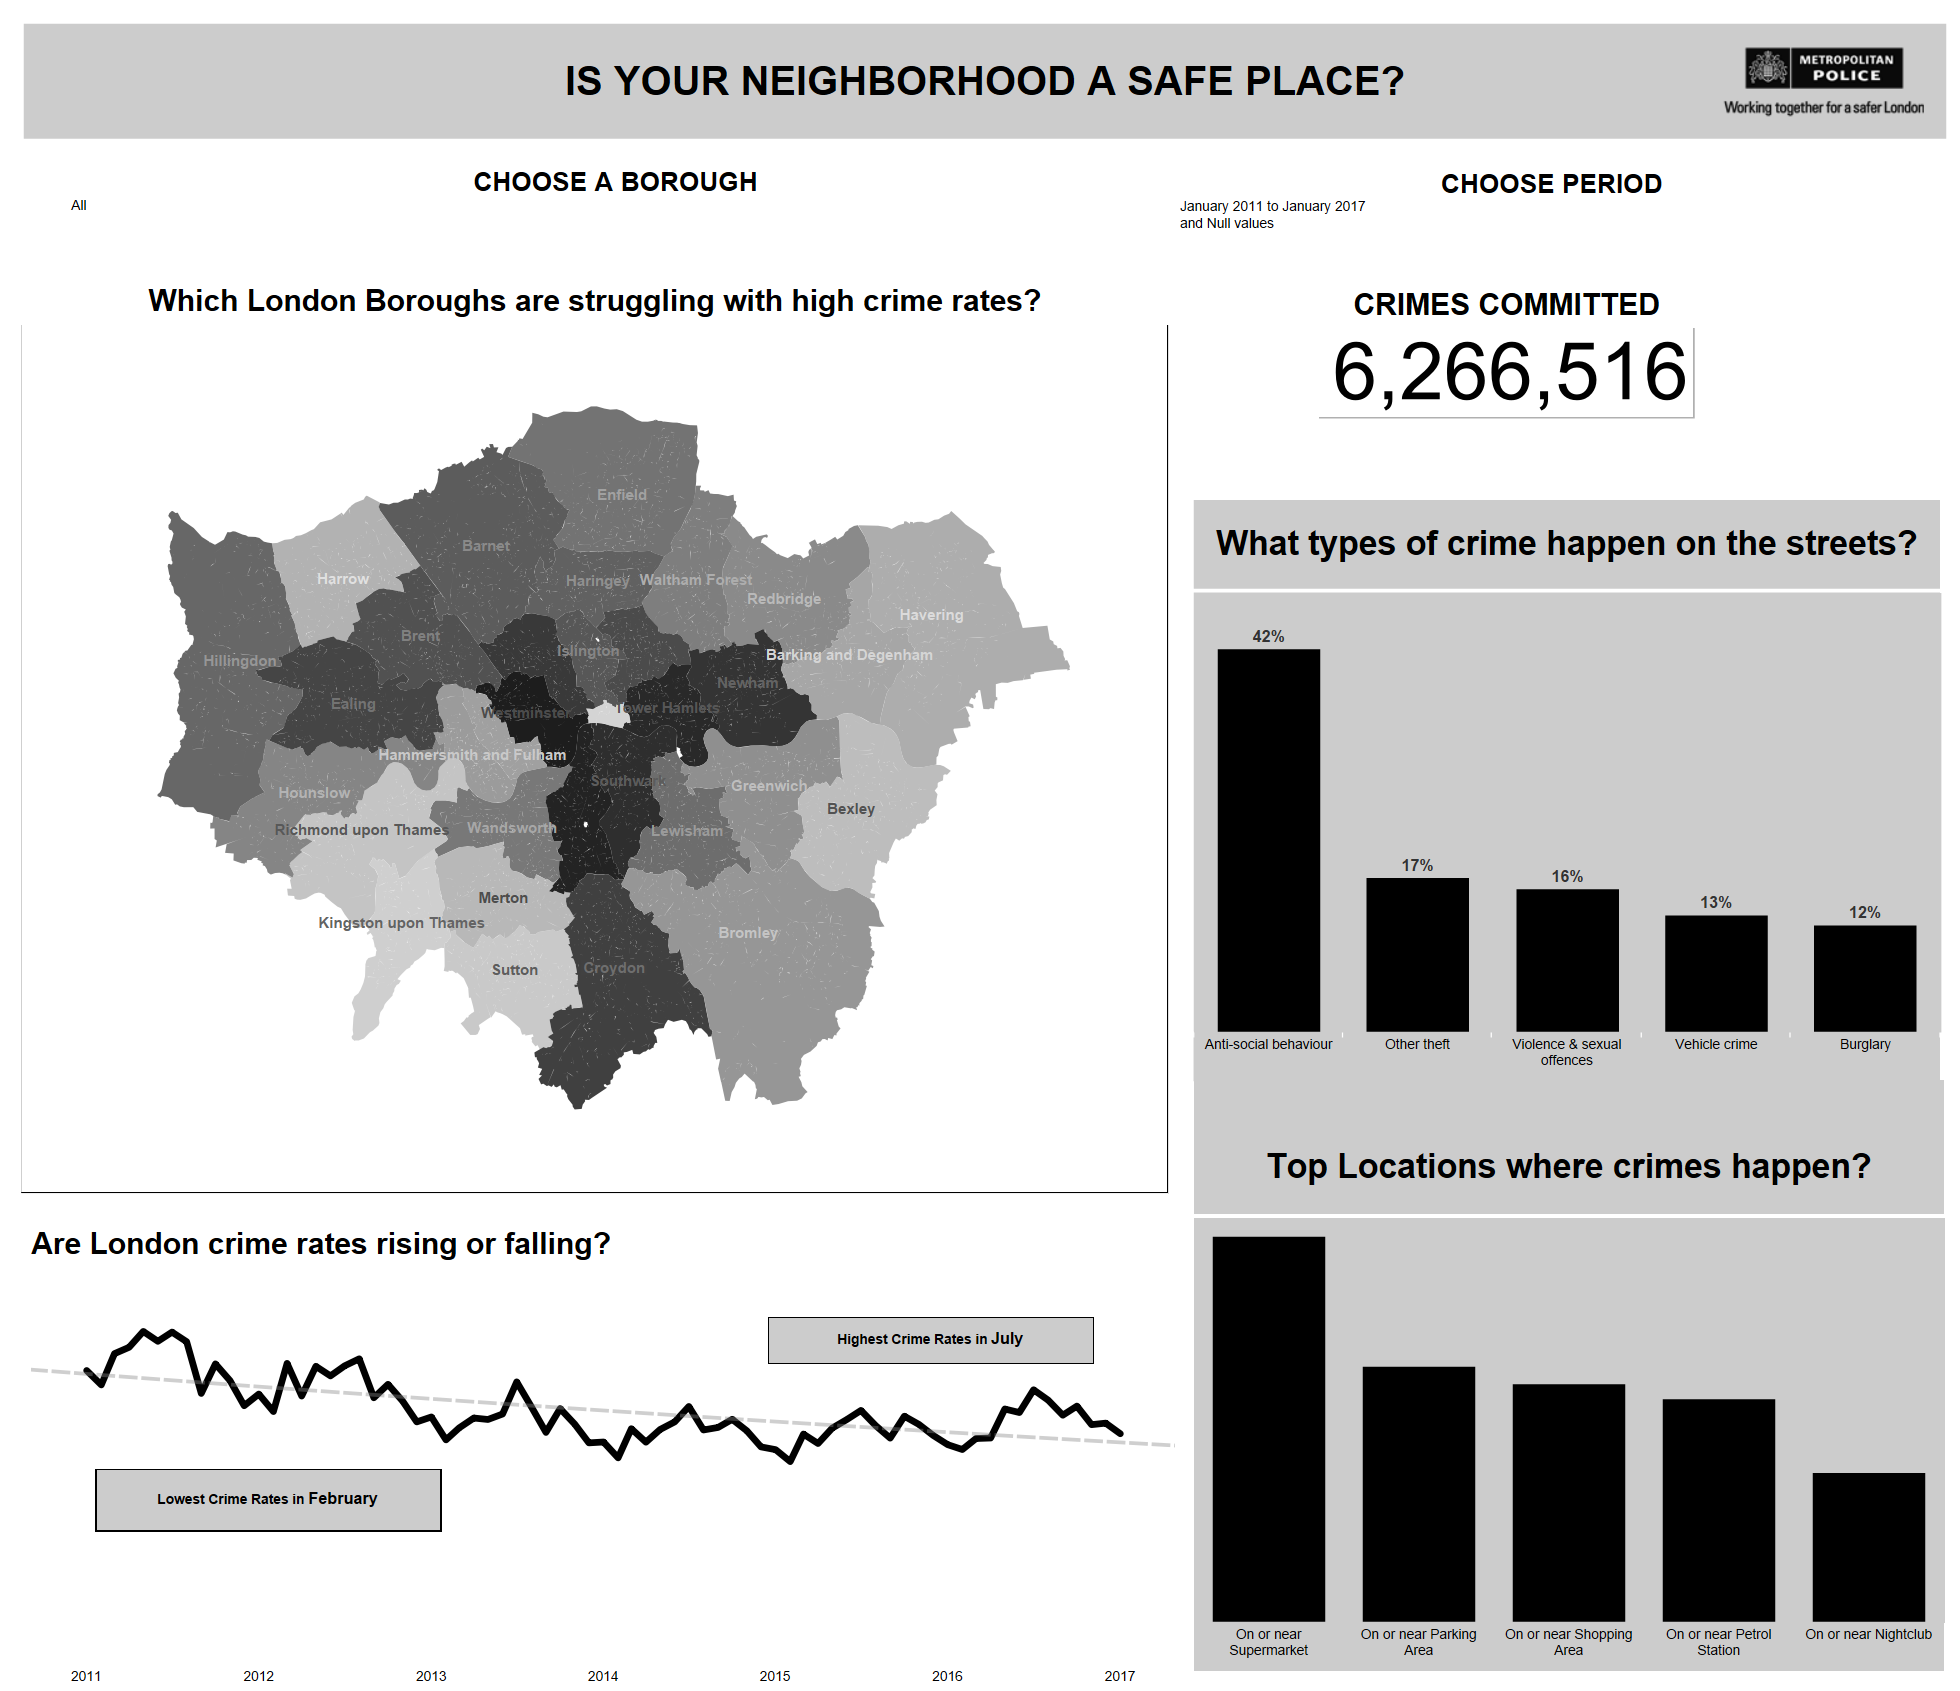
Layout: Initially I went with a story layout, which on the very beginning I was not overly happy with. This time around I went with one dashboard which allows for smoother and simpler information consumption. It allowed me to shorten the unnecessary length which I really liked.
Colour: The colour pallet in both cases was inspired by the Metropolitan Police colours of black and white with some blue. I had added bright yellow inspired by the police vests and opted to use a black background. It ended up looking as messy as the description sounds. For the makeover, I used only black and white with grey to make things lighter on the eyes.
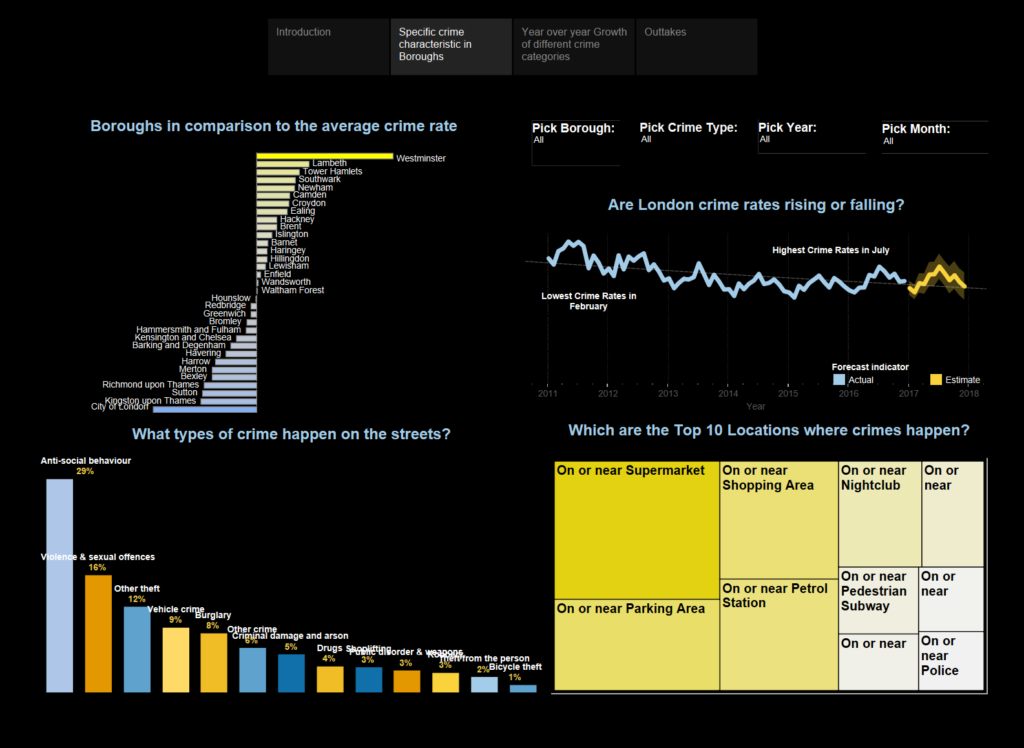
Charts: The original post had way too many things going on, including number of charts. My aim was to tell the same story but much more efficiently, with less visuals. The number of charts went down from 6 to 4 in the definitive version, somethings I was pleased with. I believe the map worked well so I kept that along with the line chart. Bar chart for crime type also stayed in game and the only chart that changed type was the one showing locations of crimes. I changed the initial treemap to a bar chart.
All in all, I liked the makeover much better than the original. However, there are still things that can be done better. Nothing can be done perfectly to a point that nobody would change anything about it, so I try not to stress about smaller things. Makeover Mondays are a great for allowing you to see your own progress over time as well as motivating you to think about a project after you finished it, finding better ways to do things.