


Last day of Dashboard Week and since it’s also the end of our training phase I can say I feel really tired and working on this task made me even sleepier, nonetheless it was really fun to work on the topic.
The dataset came from Kaggle and it’s a sleeping pattern study from 452 people in 2021. For today, I wanted to focus more on my design and container skills. At the top, we see important five metrics like the average sleep length, the least and most amount of sleep, and the average sleep efficiency. The last metric Above Target shows the share of people who managed to reach a given sleeping target. The Sleep Foundation recommends that the majority of adults should strive to get between seven and nine hours of sleep each night.
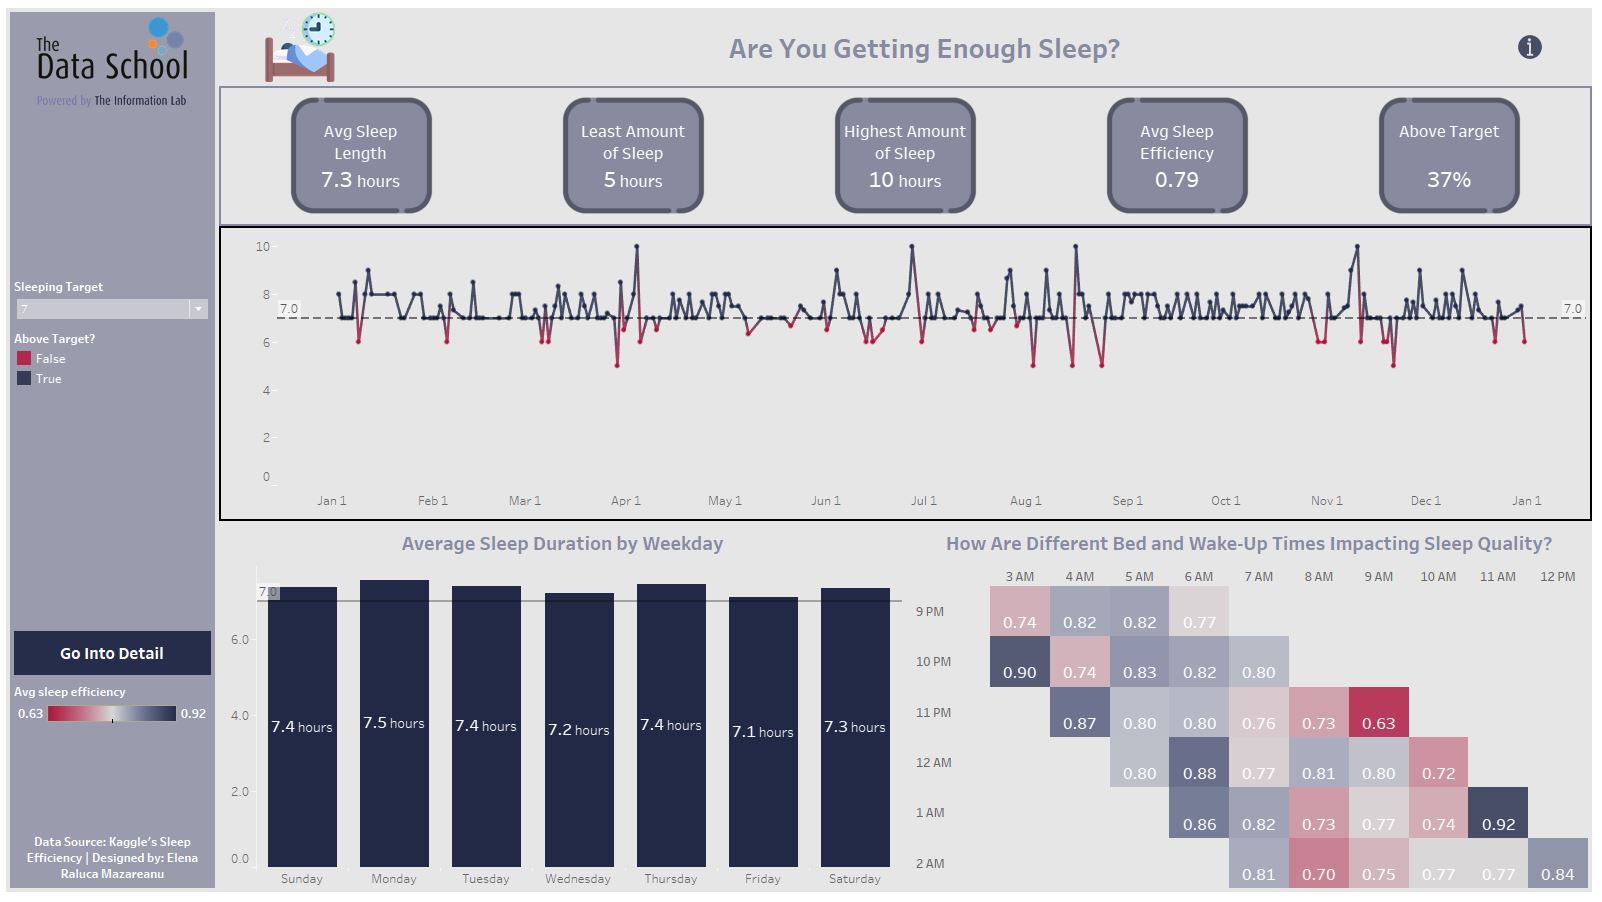
The line chart shows the distribution of the average sleep duration daily. Using the Sleeping Target we can see on which days people slept on average above the sleeping target. At the bottom, we see how much people are sleeping by weekday. What I find interesting is that people tend to sleep more on Monday and less on Friday. If we take a closer look, we can also see how different bed and wake-up times impact sleep quality.
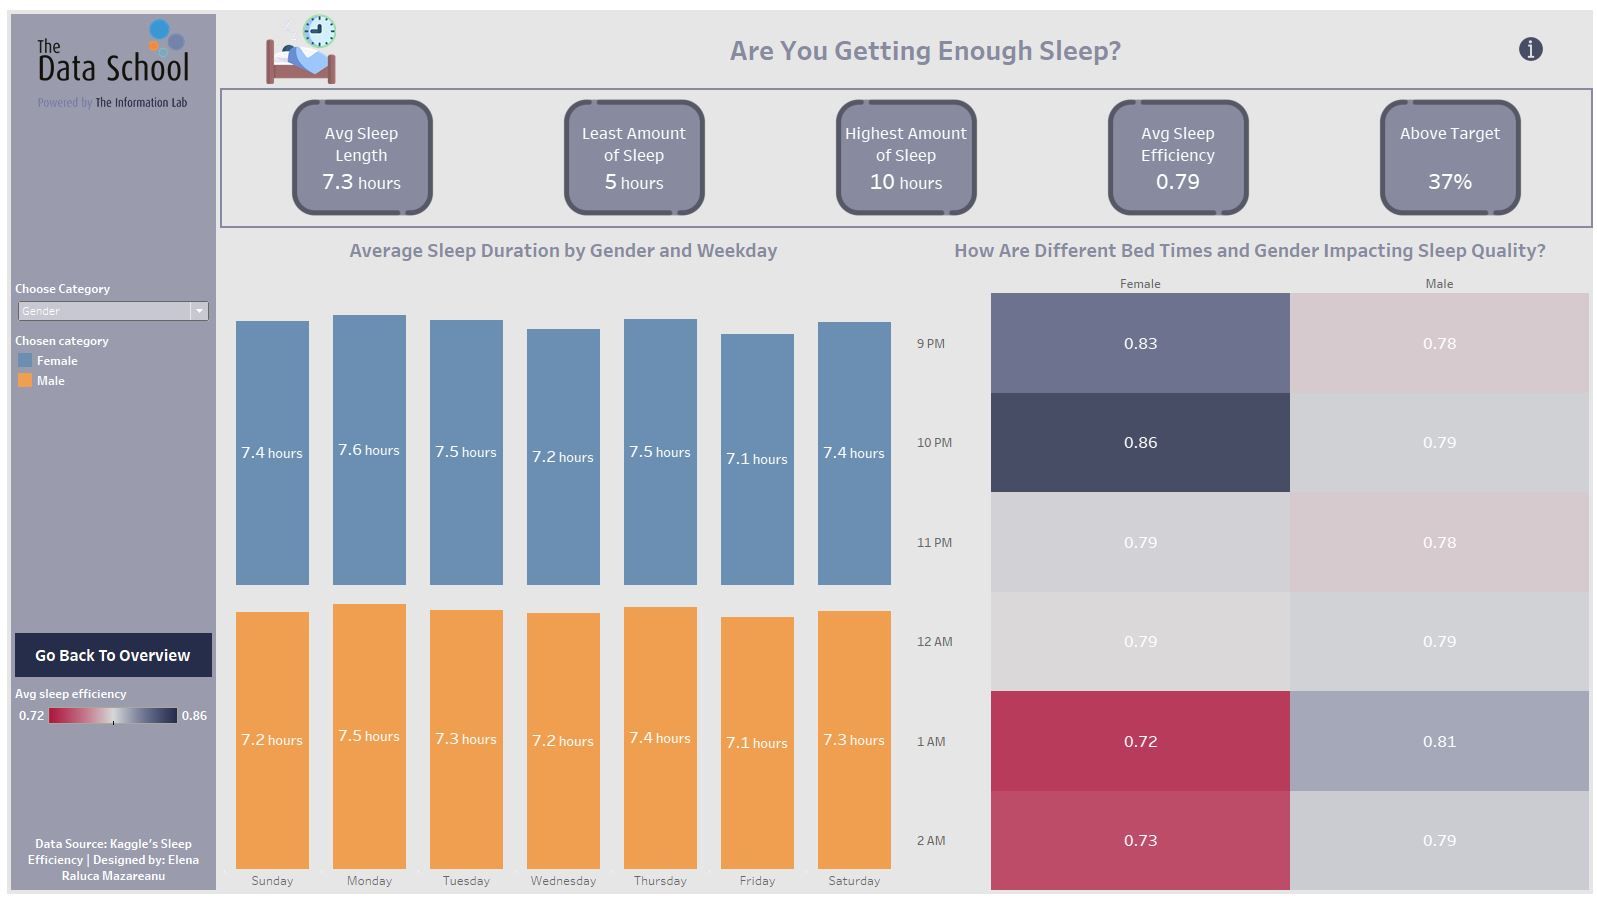
We can also go more into detail and see the average duration of sleep and quality broken down by categories. If we split the analysis by gender, we see females sleep on average more than men. However, when men go to bed later they get better sleep than females.
That’s it for today, next week starts bench time. I’m looking forward to no training days but I also want to set high goals for me to keep learning and improving myself.