


Alteryx is a data analytics and visualization platform that allows businesses to blend, analyze, and visualize data from various sources. It is designed to help users easily prepare, blend, and analyze data using a drag-and-drop interface, without the need for coding. Alteryx offers a range of tools and features for data preparation, data blending, and predictive analytics but what not so many might know is that you can also create reports using the Reporting tools pallet.
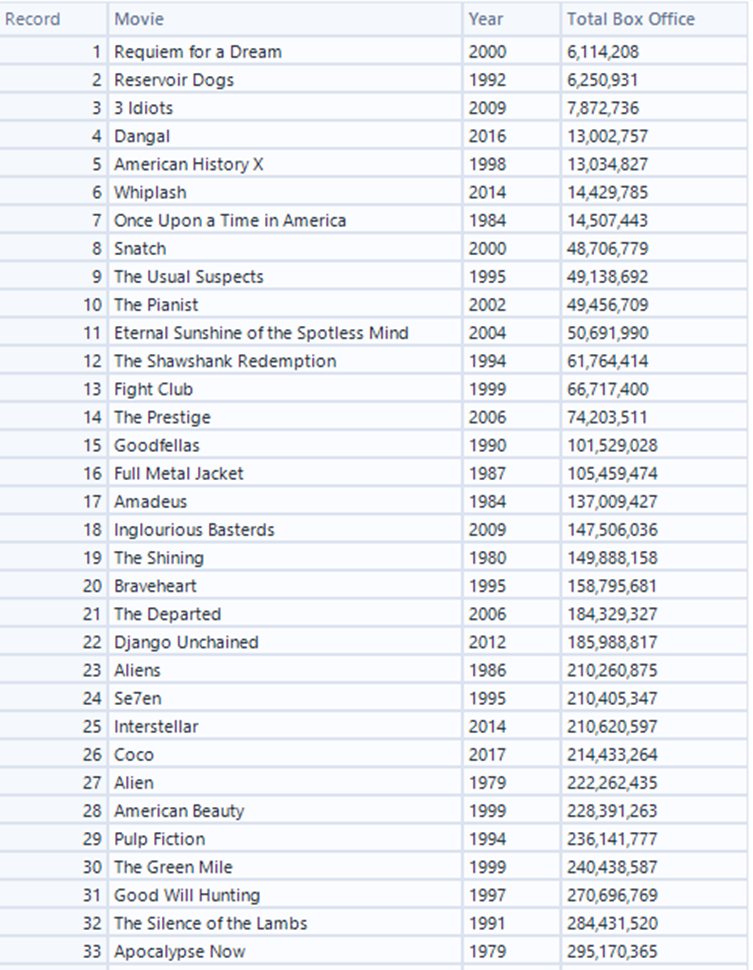
In this article, I’m going to talk about some of the reporting tools I used during my Alteryx training. Let’s start by loading our data into Alteryx. We have the top 50 IMDb movie list and their box office grossing. This can be done by dragging and dropping the data file into Alteryx or by using the Input Data tool.
Once the data is loaded, we can use the various reporting tools available in Alteryx to create our reports. Some of the most commonly used reporting tools in Alteryx include:
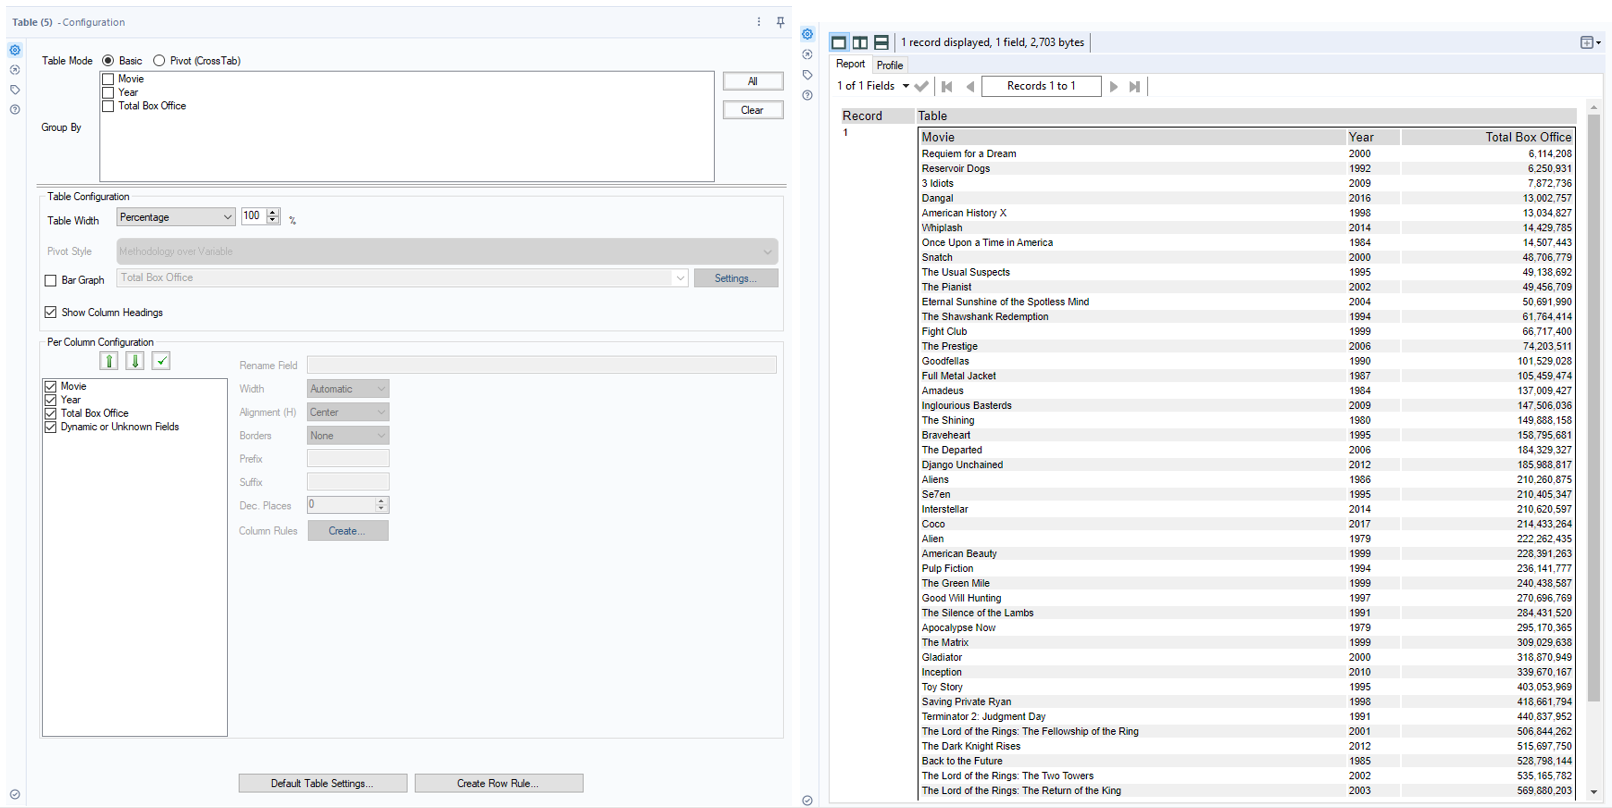
o Table Tool: This tool allows you to summarize your data in a table format. You can group your data by specific fields and calculate various statistics for each group.
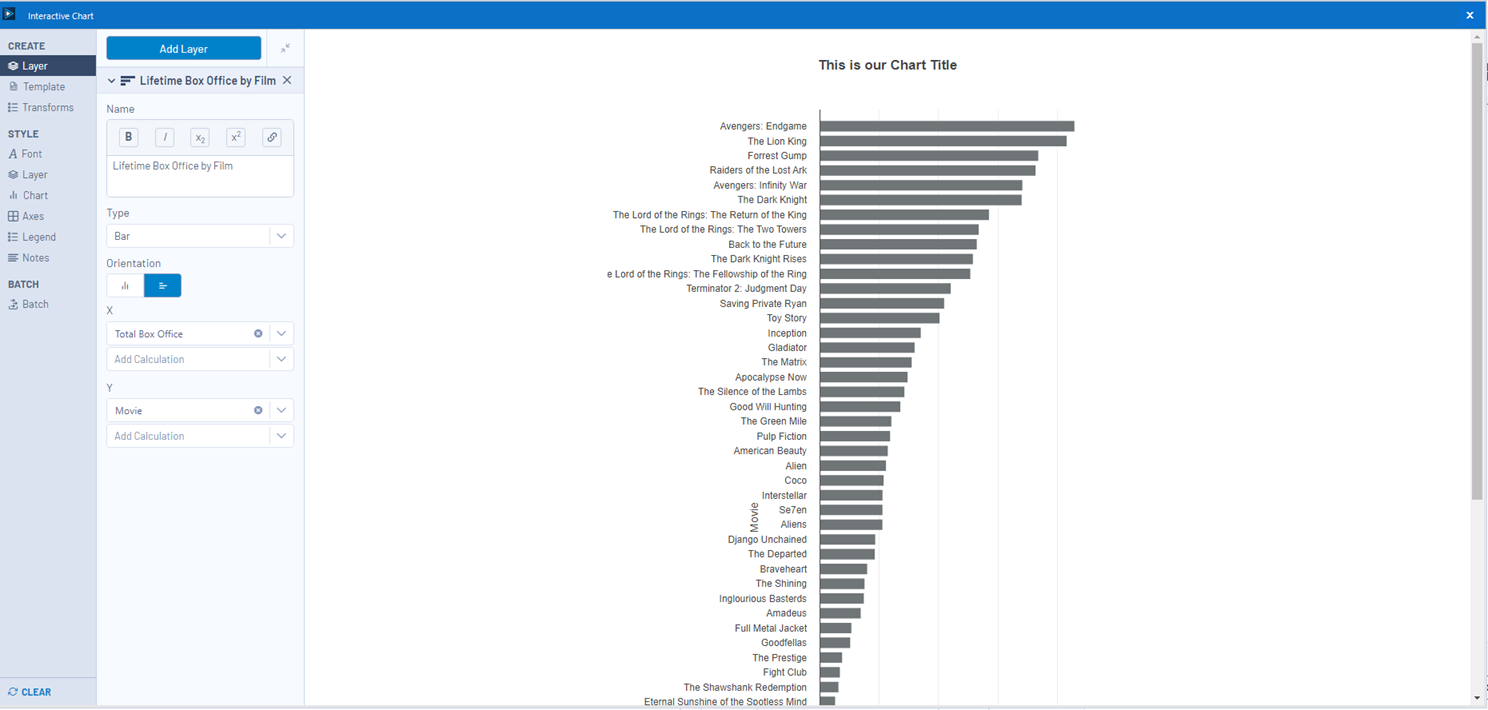
o Interactive Chart Tool: This tool allows you to create various types of charts and graphs to visualize your data. You can choose from a variety of chart types, such as bar charts, line charts, and scatter plots.
o Reporting Map Tool: This tool allows you to create interactive maps based on spatial data. You can customize the maps with markets, shapes, layers, and labels and can provide a range of interactive features like zooming, panning, and filtering.
Since our dataset doesn't have any spatial data, we can't build a map using the reporting map tool but you can see examples in Alteryx by right-clicking on the icon.
To use any of these tools, simply drag and drop them onto your Alteryx canvas. You can configure each tool by double-clicking on it and selecting the appropriate options. Once you have created your report, you can output it in a variety of formats such as PDF, Excel, or HTML, using the Render tool.
Although not used much, the reporting tools in Alteryx are very flexible and powerful, allowing us to create customized reports that meet our specific needs.