It is the last week of The Data School and that means dashboard week! Dashboard week is where a coach will set a brief and we willhave to do data prep and create a dashboard accordingly. To do this we are given about 6 hours with the brief being set at 9:00 and presentations of our work at 15:30. Today's brief can be found here.
In summary, the brief requires us to find a cool story in data from myanimelist.com from here and create a dashboard!
The Process
I started off by reading about the data in the data card on kaggle before downloading the cleaned sets of data. There were three .csv files to download:
- Anime - each row is an anime and contains descriptions of it
- Anime Lists - each row is an anime that the user has watched
- Users - each row is a user and contains demographic data of them
After downloading the data, I started investigating it in Alteryx, gathering an understanding of what each field was and what it needs doing to it. While doing this I thought about what fields would be the most useful and how to relate the different datasets together. I then spent some time planning what I thought I might like to do so that I wouldn't spend time cleaning fields that I wouldn't use. My use case focussed on user activity but as I was concsious of time, my plan was quite rough. Following this, I then cleaned the data in Alteryx according to the notes I had made earlier.
Having cleaned the data, I started building charts in Tableau and following my plan but also exploring what insights could be made from the data. I expanded on my original plan (after going down a couple rabbit holes of other charts) and sketched up how I wanted my charts to fit together on a dashboard. With just over an hour to go I put together my charts onto a dashboard!
My Ouput
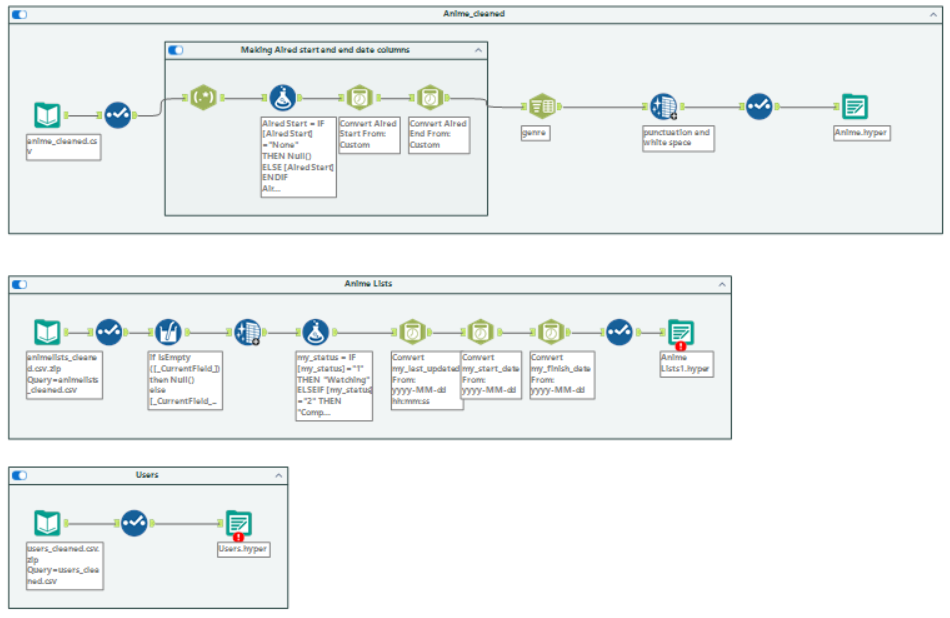
Data Cleaning
The workflows for all three datasets are shown below. For the Anime dataset, main things I did were:
- Make date fields a data format and type
- Change data types of other fields as they were all strings
- Parse out the genre of the animes to have a row each (this allows for filtering by genre)
- General cleaning and remove fields that I didn't need
For the Anime Lists dataset I minly just converted the date fields to a date type as well as remove fields I didn't need.
For the Users dataset, I just changed the data types of the fields as well as removing fields I didn't need.
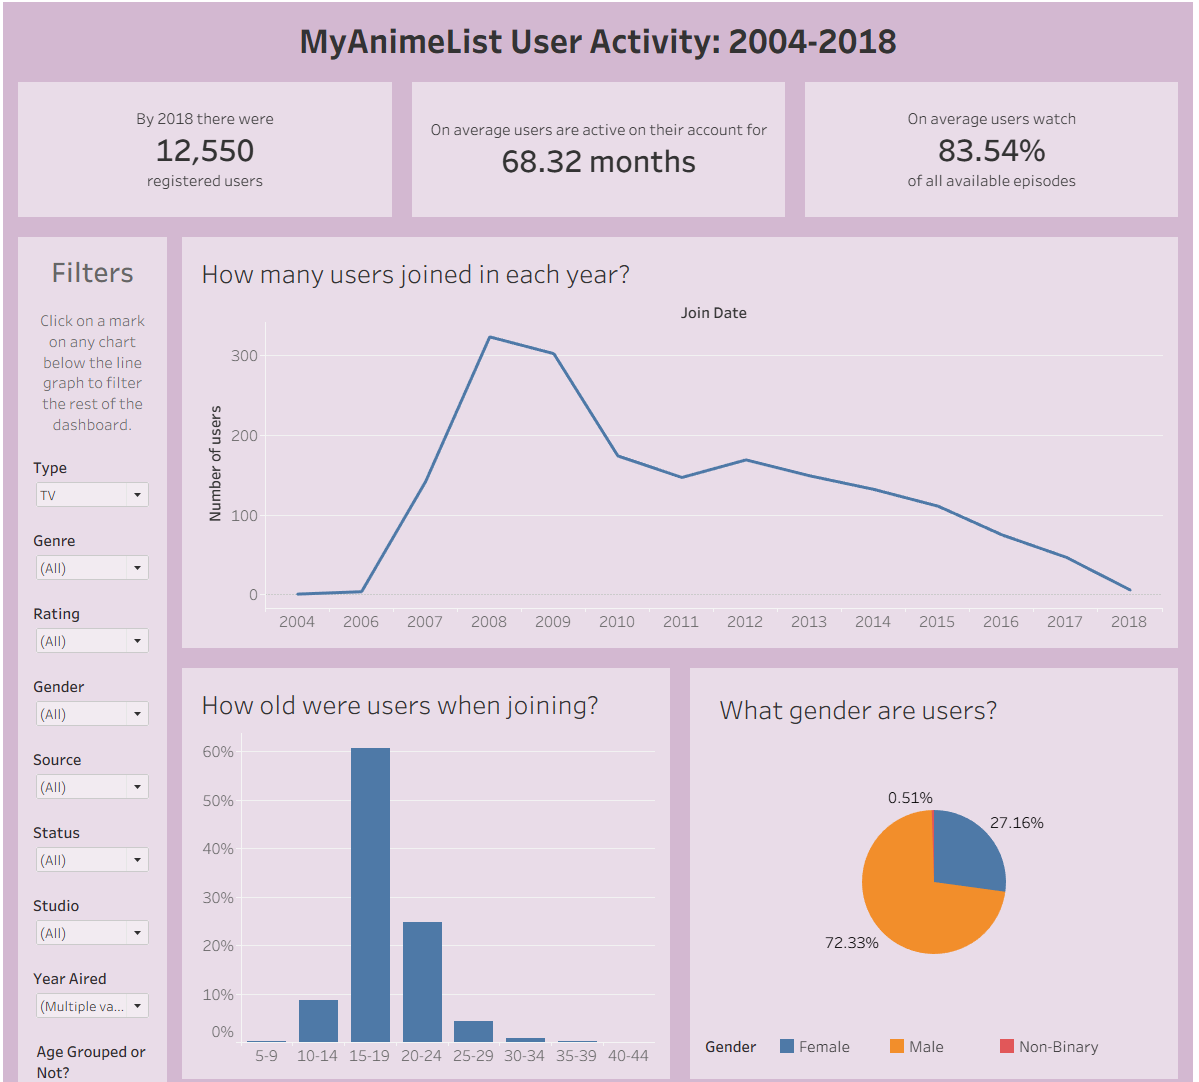
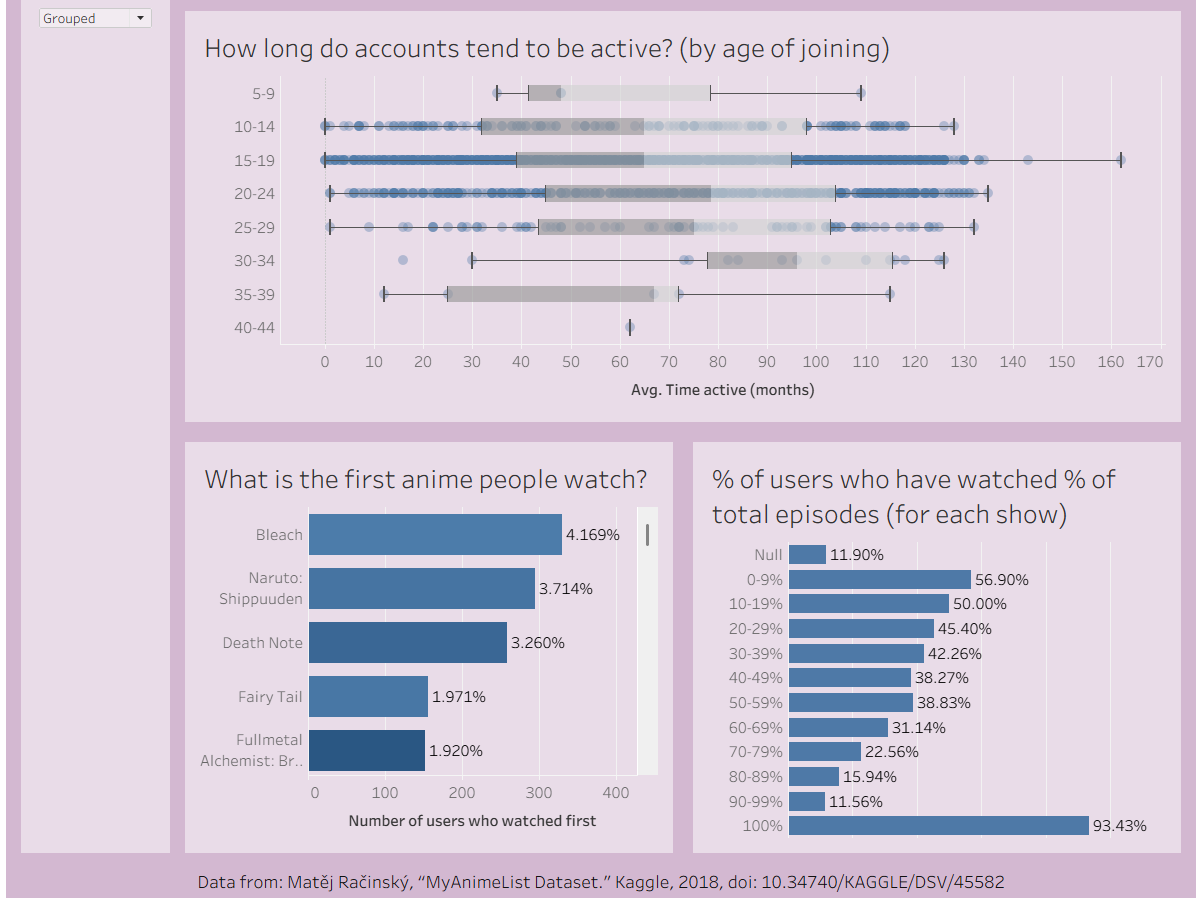
The Dashboard
Click here to see my dashboard on Tableau Public. Below are images of the final dashboard. And that concludes day 4 of dashboard week!