It is the last week of The Data School and that means dashboard week! Dashboard week is where a coach will set a brief and we willhave to do data prep and create a dashboard accordingly. To do this we are given about 6 hours with the brief being set at 9:00 and presentations of our work at 15:30. Today's brief can be found here.
In summary, the brief requires us to pick one or multiple of NASA's API's and create a dashboard in Power BI or Tableau, or build an Alteryx App that outputs interactive charts and reports. We could not use the same API as each other!
The Process
I started off my investigating the different APIs, highlighting ones that I was interested in using. However, I took quite a while to choose an API and this meant I could not choose multiple of my choices of API (as my peers had chosen faster!). This meant that I did not start looking at the relative API until 10:00!
I used the Open Science Data Repository Public API which has data about different studies that NASA has conducted. I used the study Metadata API. I began parsing out the JSON that return from the URL and investigating the different fields - there were multiple. Once I had an idea of what was in the data, I narrowed down my scope to only include a handful of fields that would allow us to understand what types of studies were being conducted, whether they had been published, and when it had been released.
Having familiarised myself with the data, I began sketching my ideas of different chart types and having a look at the data in Tableau. This took me til lunch which was on track with my plan!
After lunch, I started building out my dashboard. However, I was pre-occupied in the afternoon with a high-priority task and so was unable to spend as much time on the dashboard as I would like. Therefore, my dashboard was not at the standard that I was happy with.
My Ouput
Data Prep
Once I had chosen my API, I downloaded it in Alteryx. It returned a JSON script that I would then parse out. This API would only allow me to download data about one study at a time, recognised by a numeric id. Therefore, I downloaded one study at first, parsing out the fields to investigate what was included in the API. There were multiple fields (about 20 initial fields - would be more once fully parsed out) included about the study. I narrowed down my focus to just 8 fields which included details about:
- the title of the study
- a short description of the study
- the factors/topics the study covered
- an ID code of the study
- the study submission date
- the study release date
- the authors of the study
- publication details (if the study was accompanied by a published report)
- publication DOI
- PubMed ID
- Publication title
I also calculated an extra boolean field which was whether the study had been published or not. I then had to do some general cleaning.
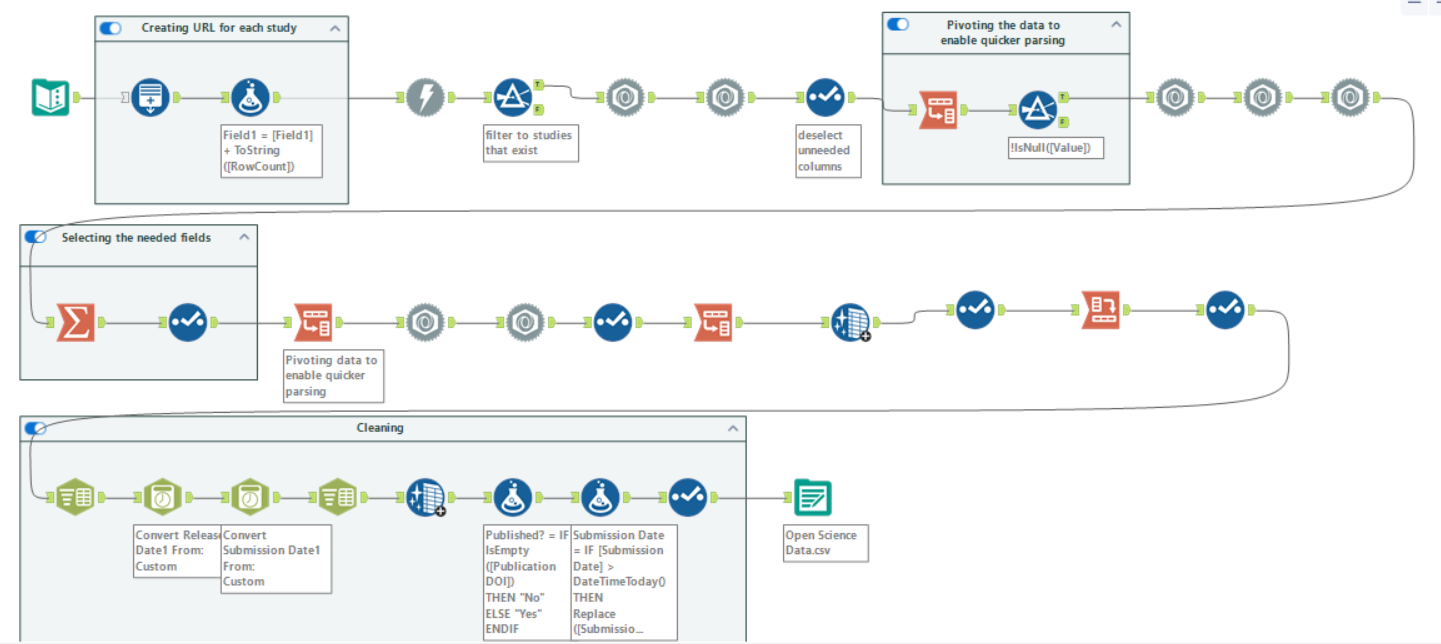
I have included a picture below of my workflow. The top two rows of tools are parsing out the fields and selecting the relevant ones. The first container is where I generated the numeric id codes for each study to be able to obtain the data for multiple studies at a time. Not all numbers had a corresponding study so after the download, I filtered to only keep studies that returned data - I got details fro 448 studies. The cross tab tools are present as I pivoted the data to have all the fields I wanted to parse out into one column so I could parse out the data more quickly than if they were in separate columns. The last row of tools is where I did a bit of general data cleaning. Each study had one or more factors but these were all in the same row, so I split this to rows, creating a new row for each different factor. I did the same thing for authors. I also had to convert the dates to a date data type.
The Dashboard
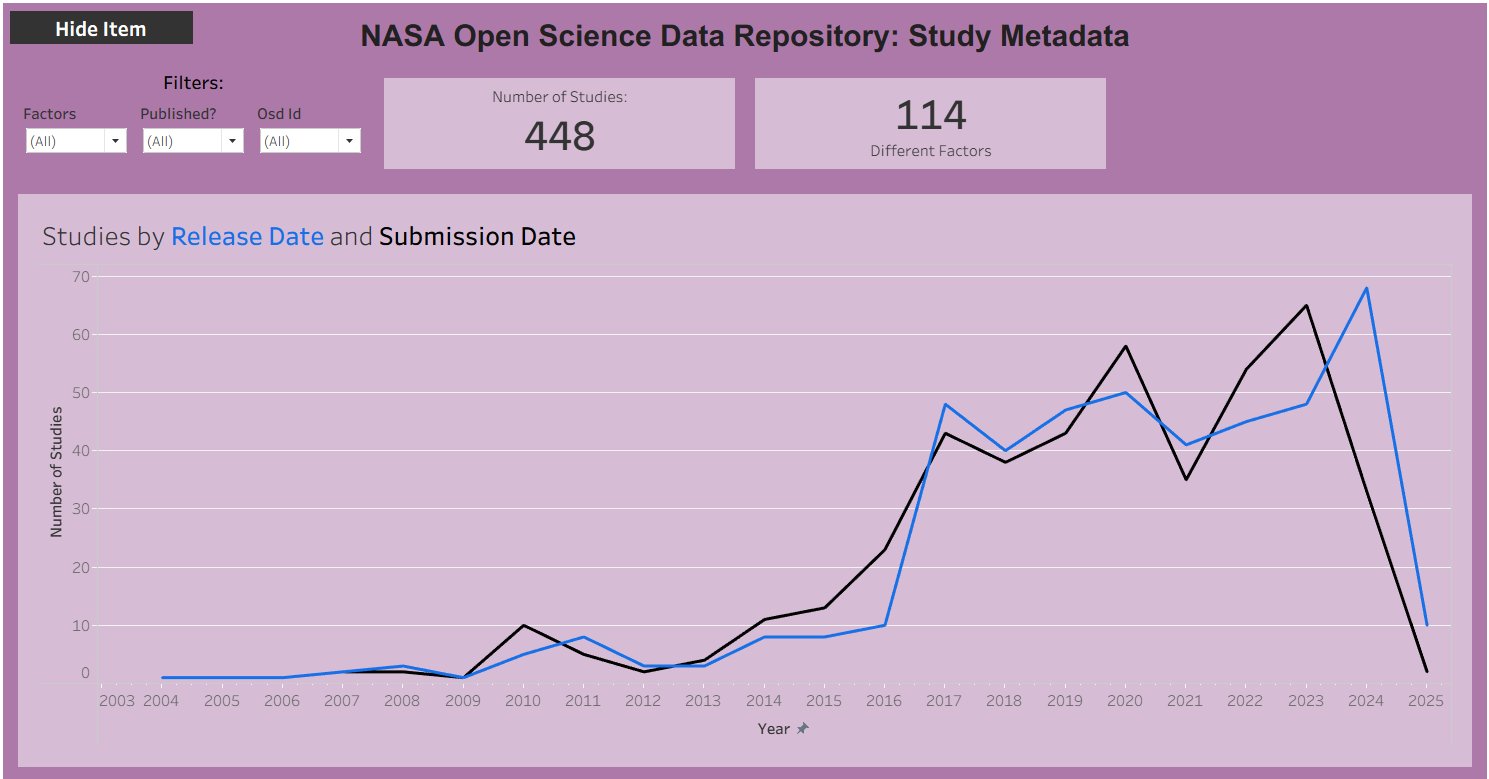
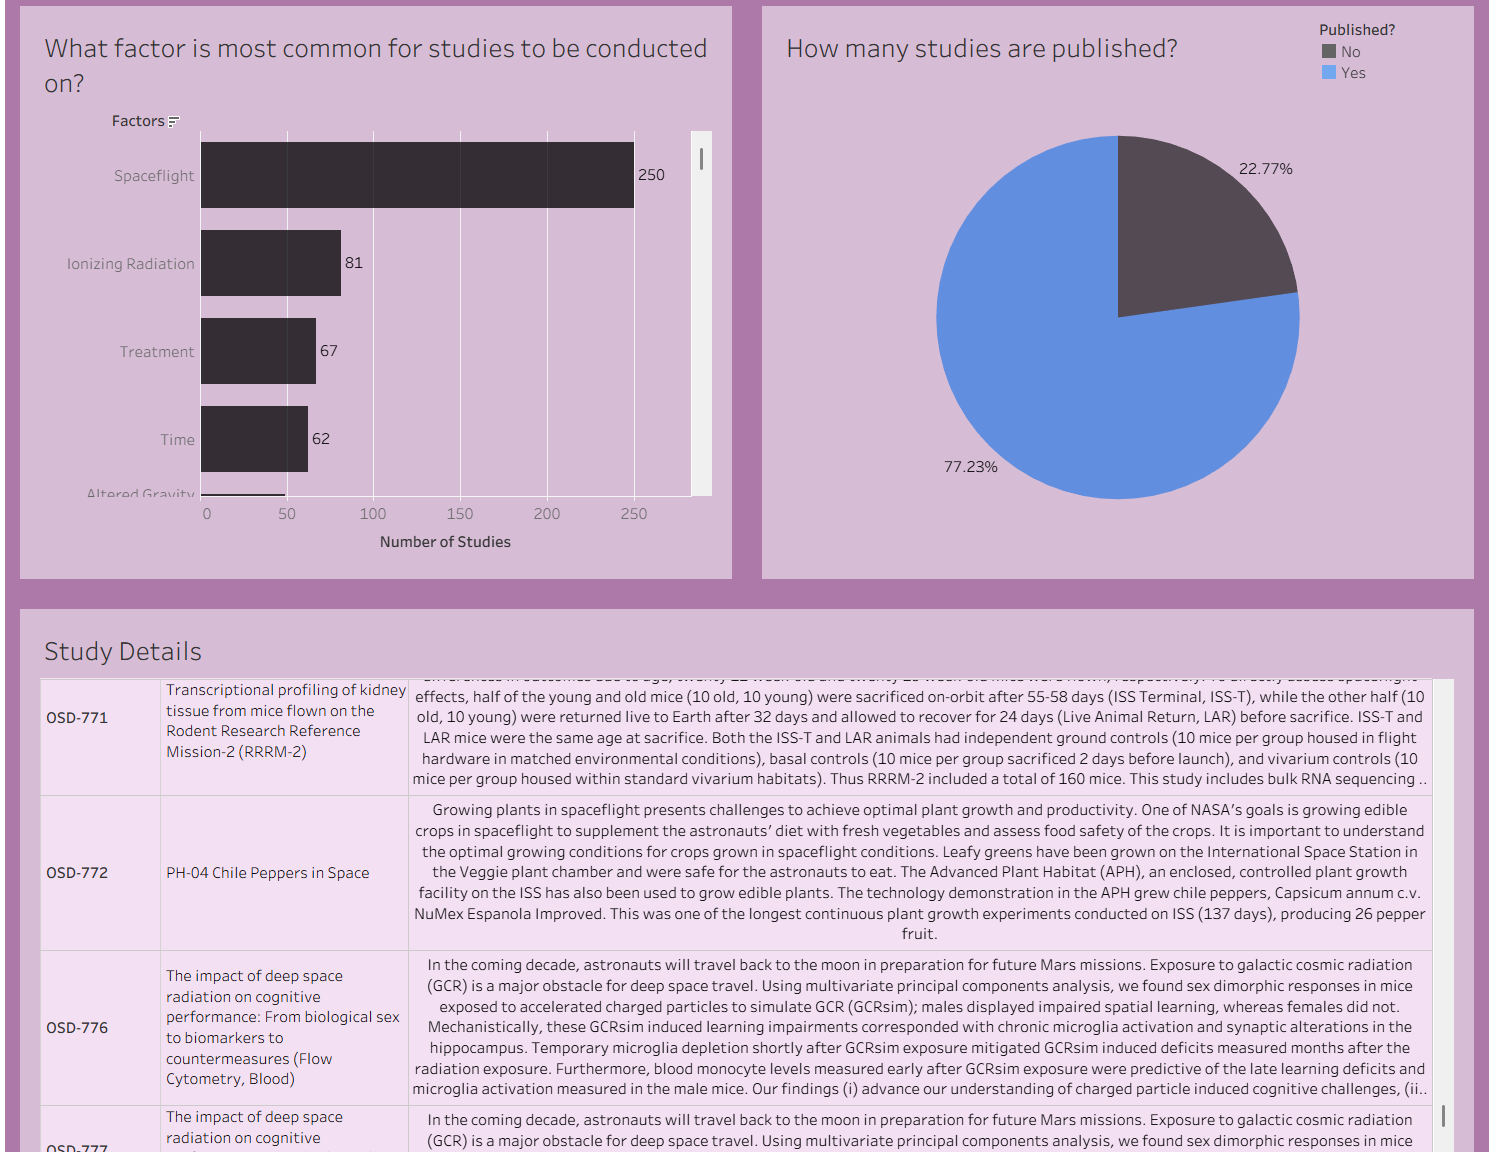
Below is a picture of the final dashboard that I was able to create during the afternoon. It was fully interactable, with the user able to click on a mark on any chart to filter the rest of the dashboard.
This marks the end of dashboard week as well as the end of my time in training at The Data School!