


What is a correlation?
A correlation is an analysis done to compare the relationship between two measures. It is most important to remember that a correlation does not equal causation. A correlation is visualised in a scatterplot.
There different types of correlations:
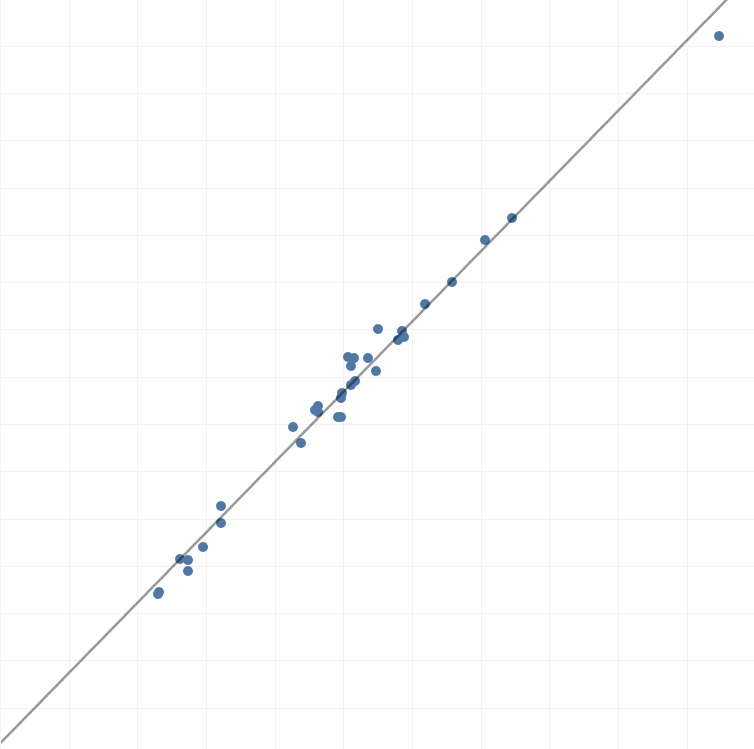
- Positive correlation
- Where as one measure increases so does the other
- i.e., the time taken to revise for a test and the score received
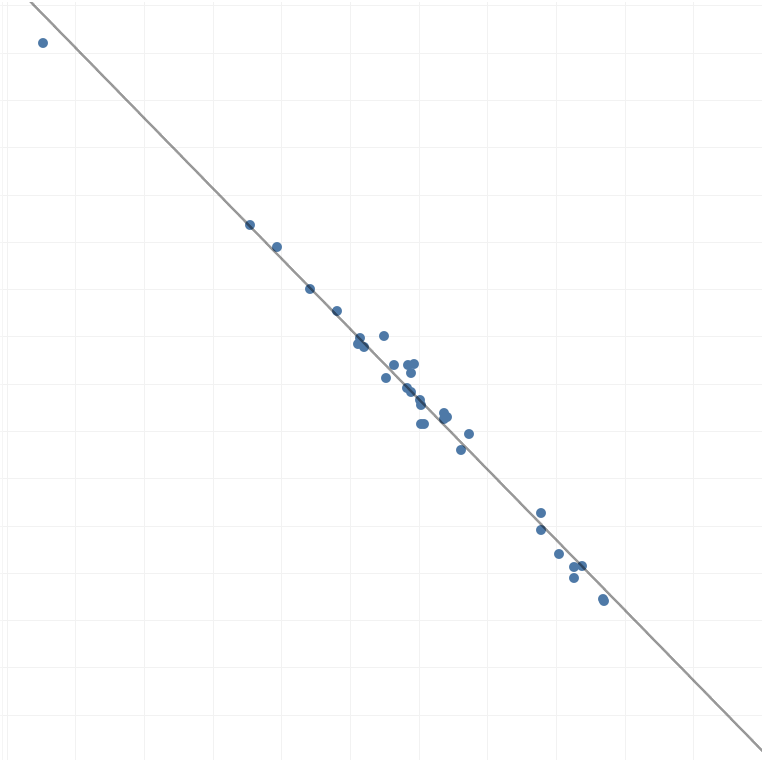
- Negative correlation
- Where as one measure increases the other decreases
- i.e., the number of days a student is absent and their test scores
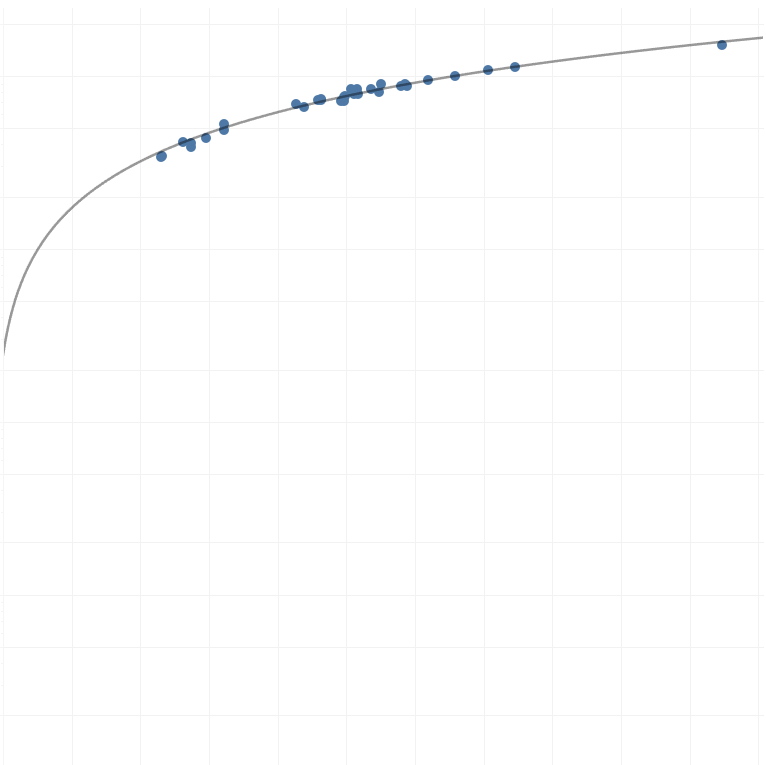
- Non-linear correlation
- Where there is a non-straight line that shows a consistent relationship
- i.e., age and height (as age increases, height does up to a point where it then levels off)
Correlation Tests
There are two types of correlation tests:
- Pearson's Product Correlation (available in both Tableau and Alteryx)
- It measures the linear relationship between the two measures
- It can only be used if the measures are normally distributed
- It returns a correlation coefficient r which is a value between -1 and 1
- Spearman's Rank Correlation (available in Alteryx)
- It measures the monotonic relationship between two measures
- It is used when the requirements for a Pearson's correlation are not met
- It returns a correlation coefficient p which is a value between -1 and 1
The correlation coefficients demonstrate the strenght of the relationship as well as the direction. Intuitively, if the value is positive, this indicates a positive correlation; if the value is negative, this indicates a negative correlation. The closer the r or p value is to 0, the weaker the correlation
In Tableau
In Tableau, only the Pearson's Product correlation is available. To do this test, use the function CORR(measure_name1, measure_name2). This will output the r value.
In Alteryx
In Alteryx both the Pearson's Product and Spearman's Rank correlation is available. They can be used through the same tool. To to do this use the 'association analysis' tool found in the Data Investigation tab.

In the configuration pane:
- Select the measures you want to test a correlation between (you can select more than 2 and this will test each measure against each other).
- Select the type of test you want to run
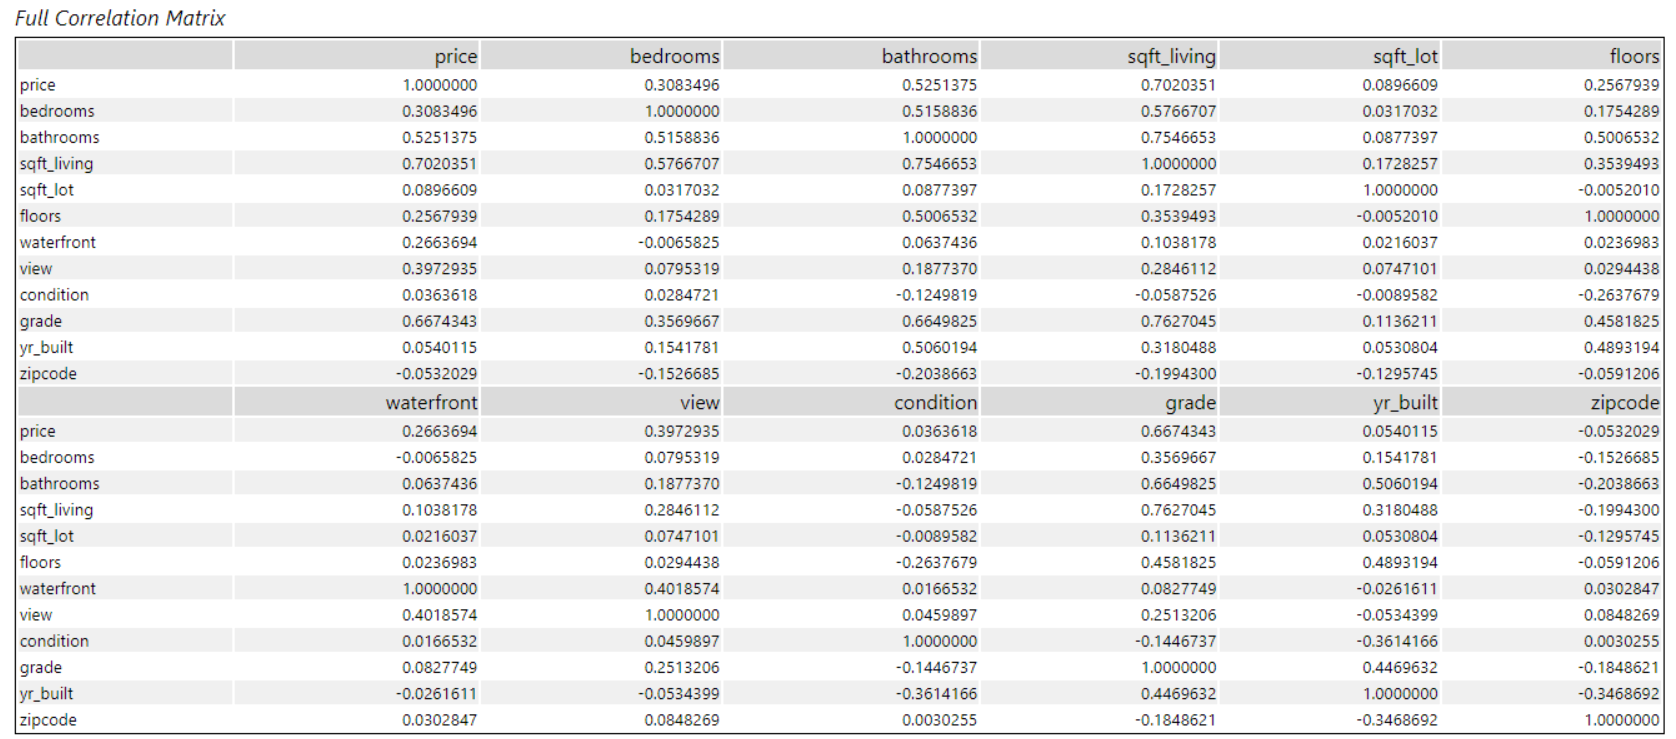
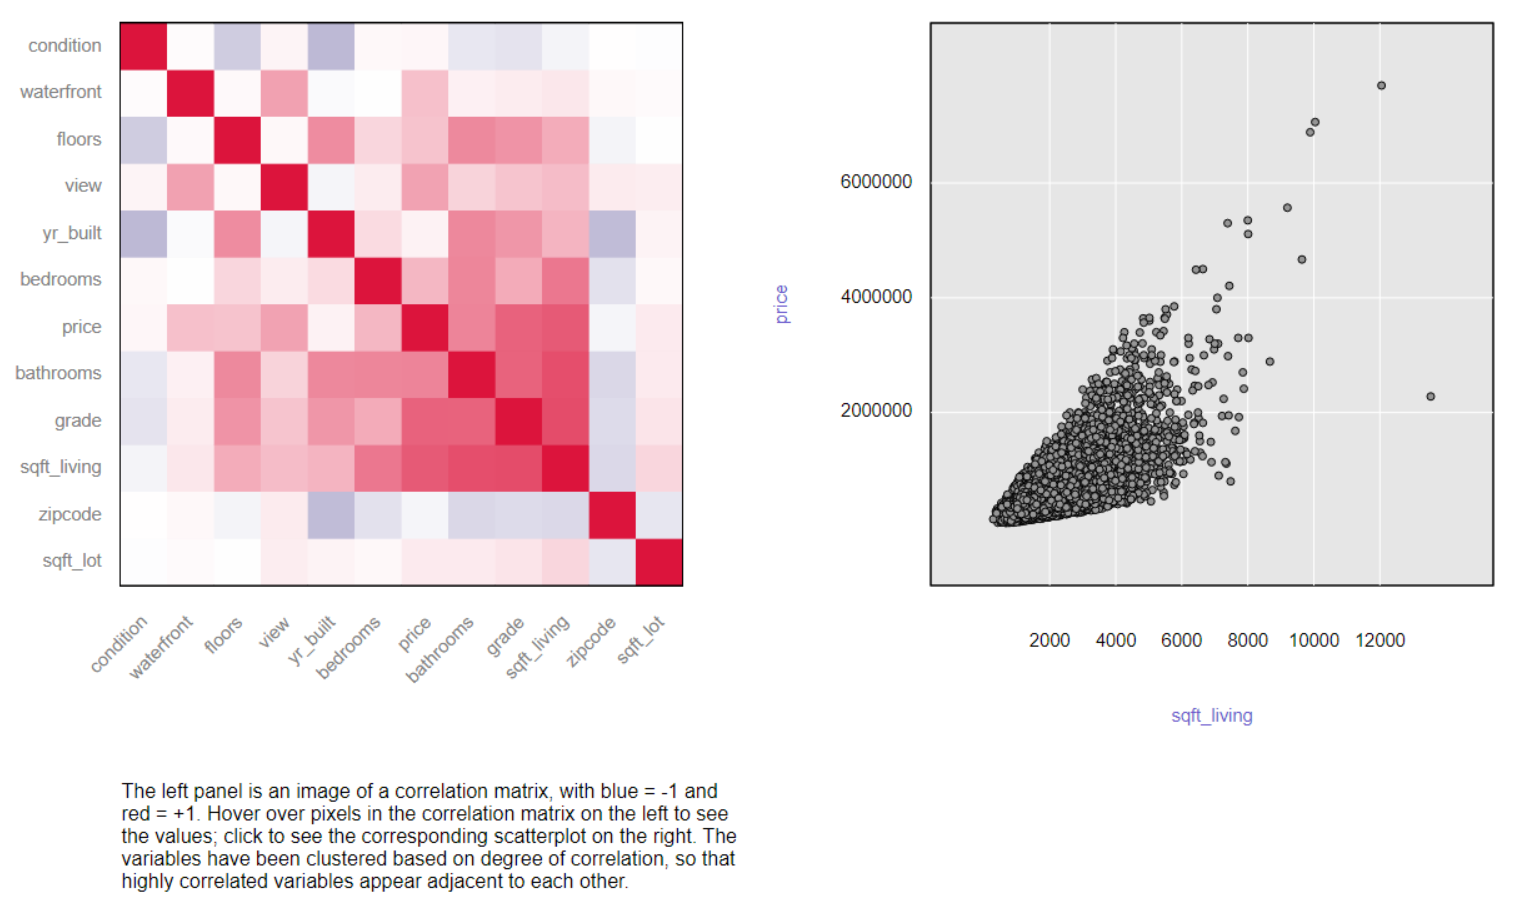
In the canvas, put the two browse tools onto the outputs and run the flow. One of the two outputs will show you a results table of the test that includes the correlation coefficients and p-values*. The other output will show you a correlation matrix for all the measures you selected alongside a scatterplot that will show when you select a relationship. See the image below to see examples of these outputs.
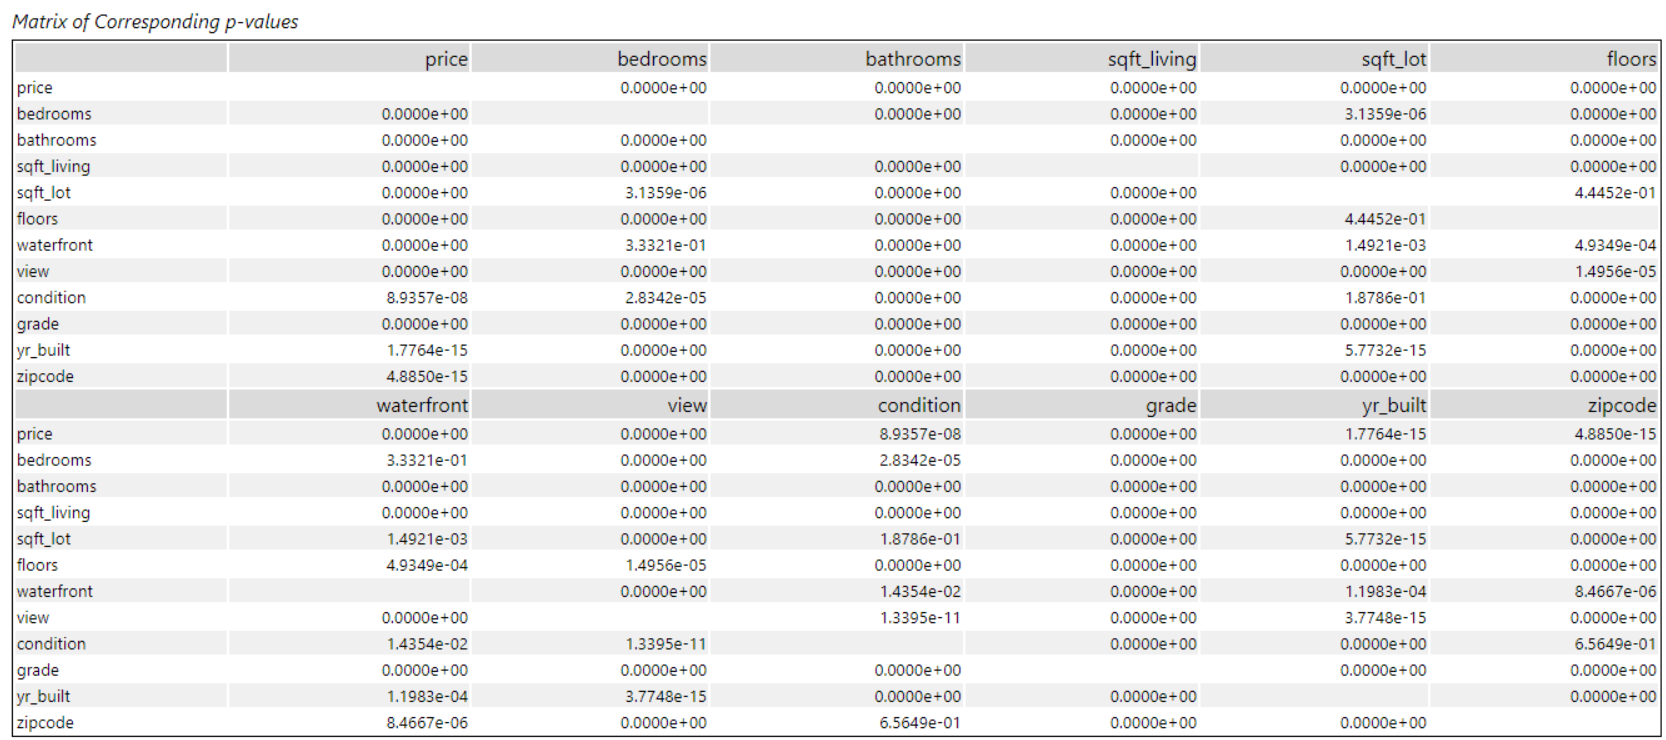
*The p-value indicates the probability of getting the result - in other words, whether the result is likely to be due to chance. It determines whether the result is significant or not. The standard threshold (most commonly used) for significance is 0.05 - if the p-value is below this threshold it is deemed to be statistically significant, if it is above, it is not statistically significant.