The afternoon of Day 2 started with a sort of pre-introduction to Alteryx before the main introduction course of day 3 and 4 of DS11: week 1. As Tableau is part of the Data School interview process we were all fairly familiar with it, but this was the first chance we’d got to properly learn about and get hands on with Alteryx.
First Carl took us through the more common tools, their associated icons and what they were used for. He then let us loose with a paired-exercise – prepping some finance data for use later in Tableau.
Multi-Row Formula
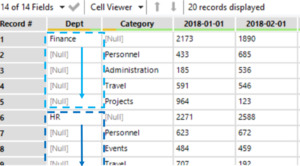
One of the things we needed to do was to assign a department to the rows which had no data; filling in the gaps.

Figure 1. Finance task original data, highlighting the cells with no values
In Excel this would’ve taken quite a while to copy/paste the values below. However, in Alteryx the wonderful Multi-Row Formula tool (Figure 2) can do this a lot quicker and more frustration-free.
![]()
Figure 2. Multi-Row Formula icon
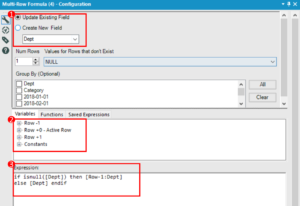
This tool can either create a new variable, or ‘overwrite’ a current variable (Figure 3: 1). In this instance I was happy for the tool to insert the data into the variable it was using to look up the missing values. The tool is clever, as I’m very quickly learning all of Alteryx is!. It allows you to reference an active row and then rows either above (-1) or below (+1) where the tool is ‘looking’ – Figure 3: 2.

Figure 3. The Multi-Row Formula configuration window
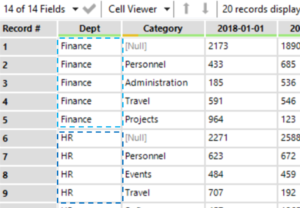
I wanted to fill in the data for the Departments into the rows below where there was a value/ category for that department. I used a formula (Figure 3:3) to get the tool to bring in the data within the variable from the row above [Row-1:Dept] if that variable was null – i.e. had no data in it – or else, if there was data there, just keep that data [Dept]. This resulted in full variables with no missing values (Figure 4).

Figure 4. Output of the Multi-Row Formula
Whilst this dataset only had 20 rows of data, this tool allows for easy, quick manipulation of big datasets. I think I’ve used it in almost every workflow I’ve created since – although I am only on day 3 of the Data School!
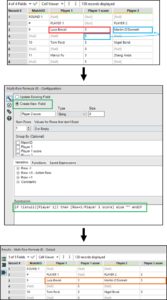
For an example of the Multi-row tool creating a new variable see Figure 5, where data was moved from a stacked column to be next to it’s associated row/ player.

Figure 5. The process of looking up/ moving values onto another row in a new variable
