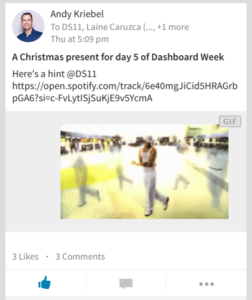
The final day of our dashboard week was so fun! We got a cheeky hint from Andy on Thursday evening with a gif featuring the BackStreet Boys.

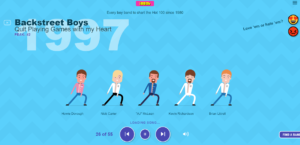
He then announced, via his blog of course, that we were to analyse data about Boy Bands from the Internet Boy Band Database. It’s incredible that this is a thing, and their website is awesome! Go check it out – they have each band singing and dancing along to snippets of their top hitting songs.
Like any other Sheffield University graduate, most of my Saturday nights there were spent at Pop Tarts so I was very familiar with Boy Bands. And of course, much of the boy band pop music was the soundtrack to my childhood. Therefore, it is safe to say I was more than excited to dive right into this one!
It was also really cool to do a less serious viz. A lot of the time we are analysing data for learning or for clients and that tends to be more serious. I really enjoyed having more of an amusing subject on this one and it showed me that it’s okay to be a bit lighter and have fun with the data!
My Approach
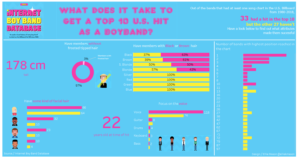
Simple – group the bands into those with a highest position in the top 10 and work out which attributes those bands had. More of an explanatory infographic of what the ingredients for a top band were, rather than an exploratory viz.
The logo from IBBDB was fun and bright so I based my design around that – as lurid and vivid as it ended up! The screen-pick feature in Tableau is really amazing.

I also incorporated a Set Action within the bar chart on the right – clicking on the position opens up which bands placed at that position. This was a relatively simple set action but thanks to Andrew and Harry they helped me work it out. I plan to investigate more of the complex set actions soon.

Here’s my final viz: have a look at the picture or click the link to see it on Tableau Public.


