To kick off a wintery dashboard week, the topic of the day was NYC snow-plow (or as we call them, snow-plough) frequency over the last 3 years or so. We were to join this to NYC street level data to explore which streets or boroughs were most often ploughed, as well as the street characteristics.
We worked as a team – Jonathan and I downloaded the data, Andrew built the Table in RazorSQL, and the others figured out what the data could say.
Data challenges to begin with
One of the big challenges on day one was downloading the Snowplough data…it took over 2 hours as it contained 250million rows! The data came from PlowNYC (link here); which at the time of our download, was last updated on 16th November 2018.
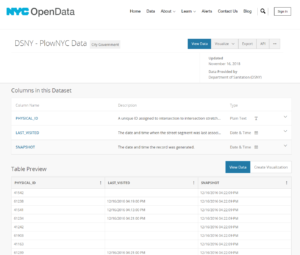
PlowNYC Data
The other challenge we had was using spatial data downloaded form NYC Open Data (link here).
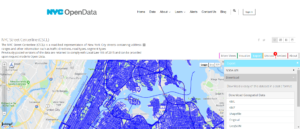
NYC Open Data: Street map
There were a few options – either to try and use the Multipointline field in the .csv text file as part of the Exasol upload, or to join the .shp shape file directly in Tableau after connecting to our data in Exasol. As far as we could tell, the Exasol database only accepted ‘flat’ shape files, i.e. lat/long and points rather than specific shape files (.shp, .shx, etc.) so we decided (and Andy allowed us) to join the shape file later on in Tableau (although this slowed Tableau down to the extent we had to filter the data massively and extract it to re-insert it).
Building the Schema
Whilst the data was downloading the table frame was built in RazorSQL. To do this we connected to the Exasol database and once loaded, going to EXA_DB > TABLE and right clicking on ‘Create table’. This allows you to create as schema for your data – essentially building an empty table.
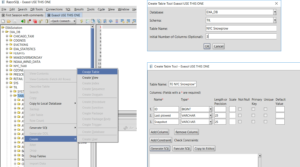
Building the schema in RazorSQL
Uploading the data
Uploading the data proved tricky to do in RazorSQL, with multiple errors being returned. So, we turned to EXAPlus and connected to the table there. We tried importing the data from the 250million row csv into the table schema Andrew created but there were still errors!
We turned to Alteryx, and made a csv of 1000 rows and tried to upload that. We were still getting errors but when we connected to the data in Tableau – you could see the data! So in Alteryx we added a RecordID tool, and then filtered and created 25 10million-row files. We used the Ceiling formula to create a new field the ‘file names’ of the 25 segments of data. Each of these were then uploaded each of those up onto Exasol.
“NYCDATA_”+TOSTRING(CEIL([RecordID]/10000000))
Finally in Tableau
Finally we were able to view the data in Tableau….although it took over 10 minutes to actually to anything in Tableau because the file was so massive, especially when connecting to the spatial data. As Andrew said “I’m pretty sure I could count rows quicker than Tableau can”…!
Top Tip: Pause the connection to the database, change the view and then update! This will decrease the number of times that Tableau talks to the data.
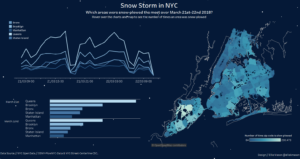
So, after using some of Andy’s magic to create a date from a string that was in a particularly tricky format – on a live database connection, we created extracts of just one day and really focused our analysis.
I focused on the 21st and 22nd of March 2018 as the article (in Quantify NYC) mentioned that this was another snow storm of interest! I also played with transparent sheets for the first time and big thanks to Andre for his Snow Storm URL background!
See it on Tableau Public here to watch the viz snow!
https://public.tableau.com/profile/ellie.mason#!/vizhome/NYCSnowPlowFreqMarch2018/FinalViz