


This week we also revisualized this fantastic piece by the Huffington Post. So once you see it, you’ll notice that it’s a difficult visualization to top.
What I found most striking about this was that despite how many deaths, it’s an incredibly challenging policy to change. I utilized a running total area chart as a metaphor for the challenge ahead fo reform.
Most of the interesting elements of this are noticeable when hovering over the charts.
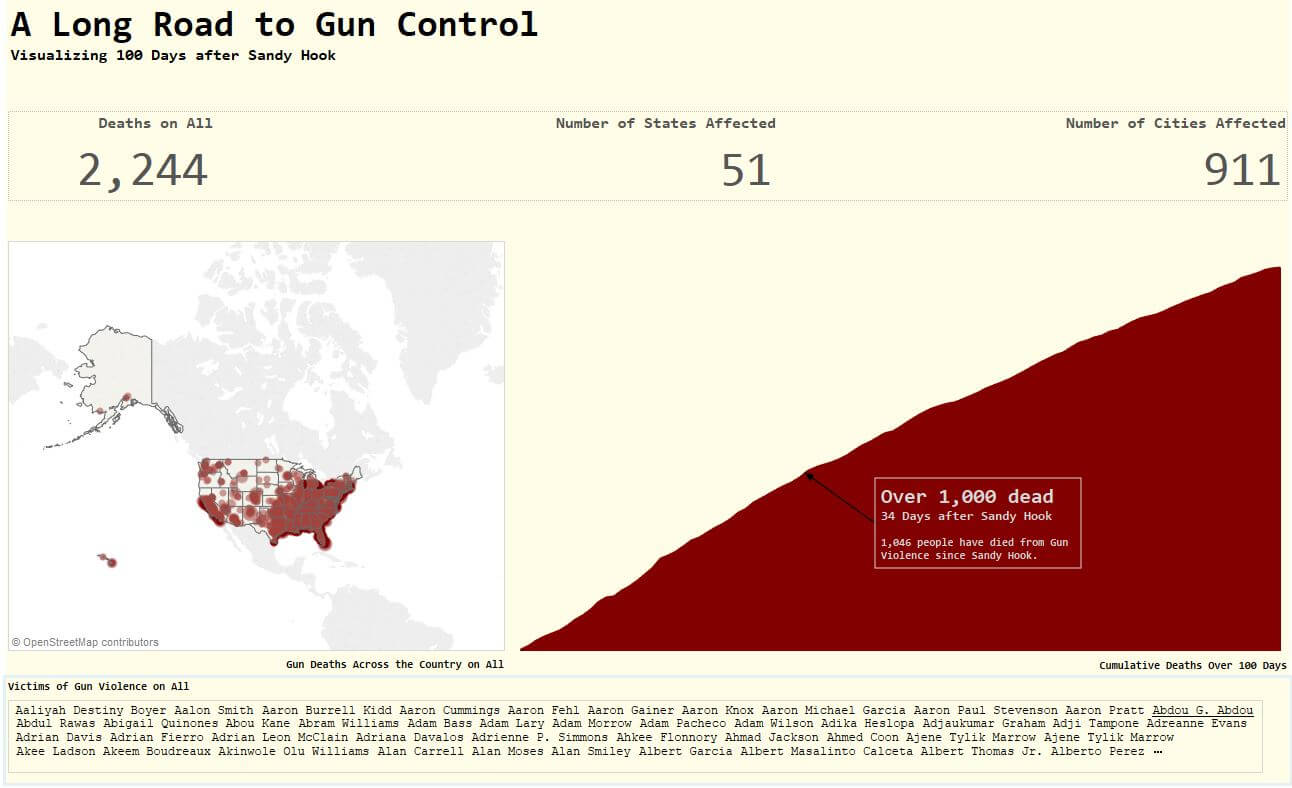
Area Chart- Shows the running total of deaths. I’ve also added an annotation to try to illustrate a marker in the data.
Map – Shows the total number of deaths by state and its rank in deaths within the 100 days.
List of Names – Shows which area they lived/died in. Selecting on the name will take you to an article about their story.
Overall, a simple reinterpretation of the Huffington Post original.