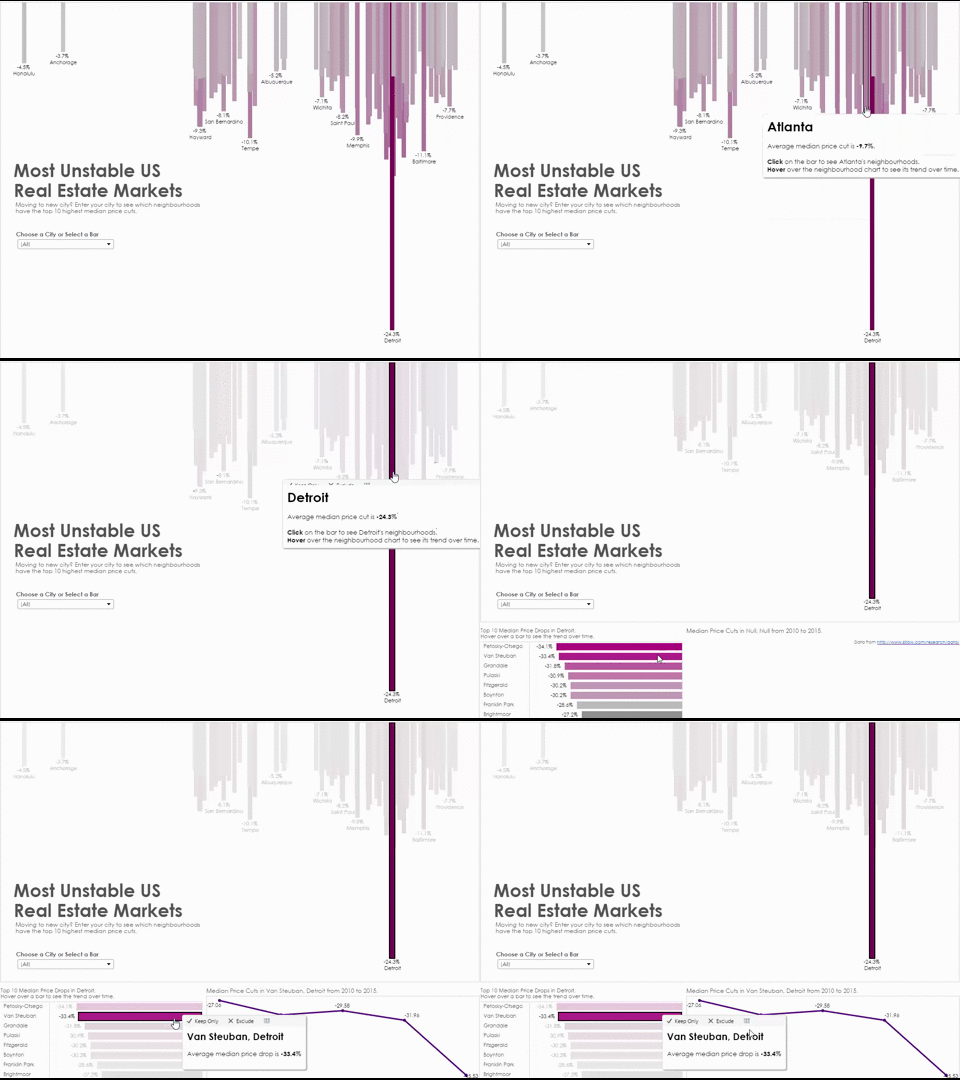
Friday was a doozy. It’s been a week where the team has been building a dashboard a day.
While not hard if we were building a series of KPI dashboards, each day we’re looking at different data sets and effectively tapping into different levels of creativity. I earned a lot this week about developing a personal style for Tableau Public. Andy even mentioned my work is looking more and more like the NYT which I’ll take as a compliment 🙂
Friday’s dataset was from Zillow’s Research Center – fantastic resource for pretty clean and diverse data.
We got 2-3 hours to work on this so definitely speed vizzing to look at the data, figure out the story and consider the layout and direction.. I will admit that I’ve cleaned it up considerably for Tableau Public (tooltip formatting, additional instructions) but the overall look and feel is sthe same.
Click on the gif to interact with the dashboard!
Have a great weekend!

