


In this week’s project, I’m interested to know how Pharmaceutical companies evaluate market sizes. The viz is finally uploaded!
Particularly since Pharmaceutical firms operate in a monopolistic industry, I wanted to create a visualization on how a conglomerate views a very human aspect of our lives– where we live.
This view is very simple since for a given drug, how large is the market size for the county you live in? It’s a riff on this Tableau Public Hall of Fame.
To do this, I scraped and blended data from 3 different sources: Pharmaceutical company information from Wikipedia, Prescription Drugs issued from 2010 to 2015 and Region (post code and county) data for the UK.
1) Pharmaceutical firms – the company name, the drugs in the form of trade name as well as chemical name
- Taken from Wikipedia (easiest place to scrape)
- To web scrape, I used this handy HTML tag stripper instead of parsing through Alteryx. The XML tool was not being friendly that day.
- I’ve limited this to 2 pharma firms, Novartis and AstraZeneca, to limit the number of rows
- I’ve also only taken 25% of the drugs they produce to limit the data size
2) Prescription drugs – chemical name, total actual ingredient cost, quantity, date and category
- Craig had very nicely parsed all the prescription data from 2010 to 2015 and uploaded this into Exasol
- To calculate market size, I needed the “total actual ingredient cost” (Market Price by Pharma) and “quantity” as the quantity sold by a pharmaceutical firm.
- The categorization of “Generic” and “Branded” within the BNF Code’s naming convention allowed me to bin the specific instance of drug prescribed into “Branded” or “Generic”. Unfortunately, because a chemical drug can be made by multiple brands and there wasn’t any indication of which brand was prescribed, I wasn’t able to calculate the market share of each brand by post code. Wouldn’t that data be worth a pretty penny? haha.
3) Region data – post code and their respective counties
- Taken from a simple google search to doogle.co.uk
Have you been keeping track of how many rows this is?
If you’ve guessed 14M rows, you should be heading to the casinos today. If you’re interested, here’s my SQL code. Did I mention this is my first time using SQL? Huge shout out to the world’s best mentor Paul Houghton for helping me with the data prep on Chemical Name and on how to structure query for the “OR”s.
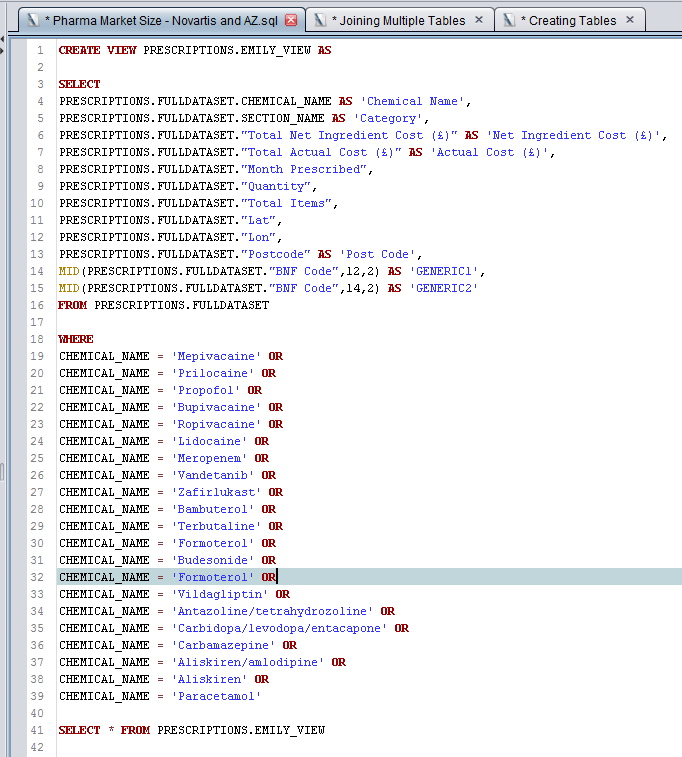
The next part is joining these 3 datasets together. My original plan was to join them in Alteryx, but because I had 14M rows in the query above, it took 25 minutes to run. Needless to say, it wasn’t efficient.
Luckily Exasol is very quick and was a great opportunity for me to learn how to upload data and create tables in Exasol. Since I had never really worked with databases before, my understanding of how information got into the database was a bit like this Zoolander scene.

Luckily, I got past this stage pretty quickly thanks to Damiana! I’ll write a another post on how to upload a table into Exasol. Hopefully, it’s helpful for someone else too 🙂