


Today we were writing postcards to Jeffery Shaffer as part of Andy and Jeffery’s Dear Data Two project. It’s inspired by the original Dear Data project where 2 ladies based across the pond from each other track their daily musings and ongoings into weekly visualizations.
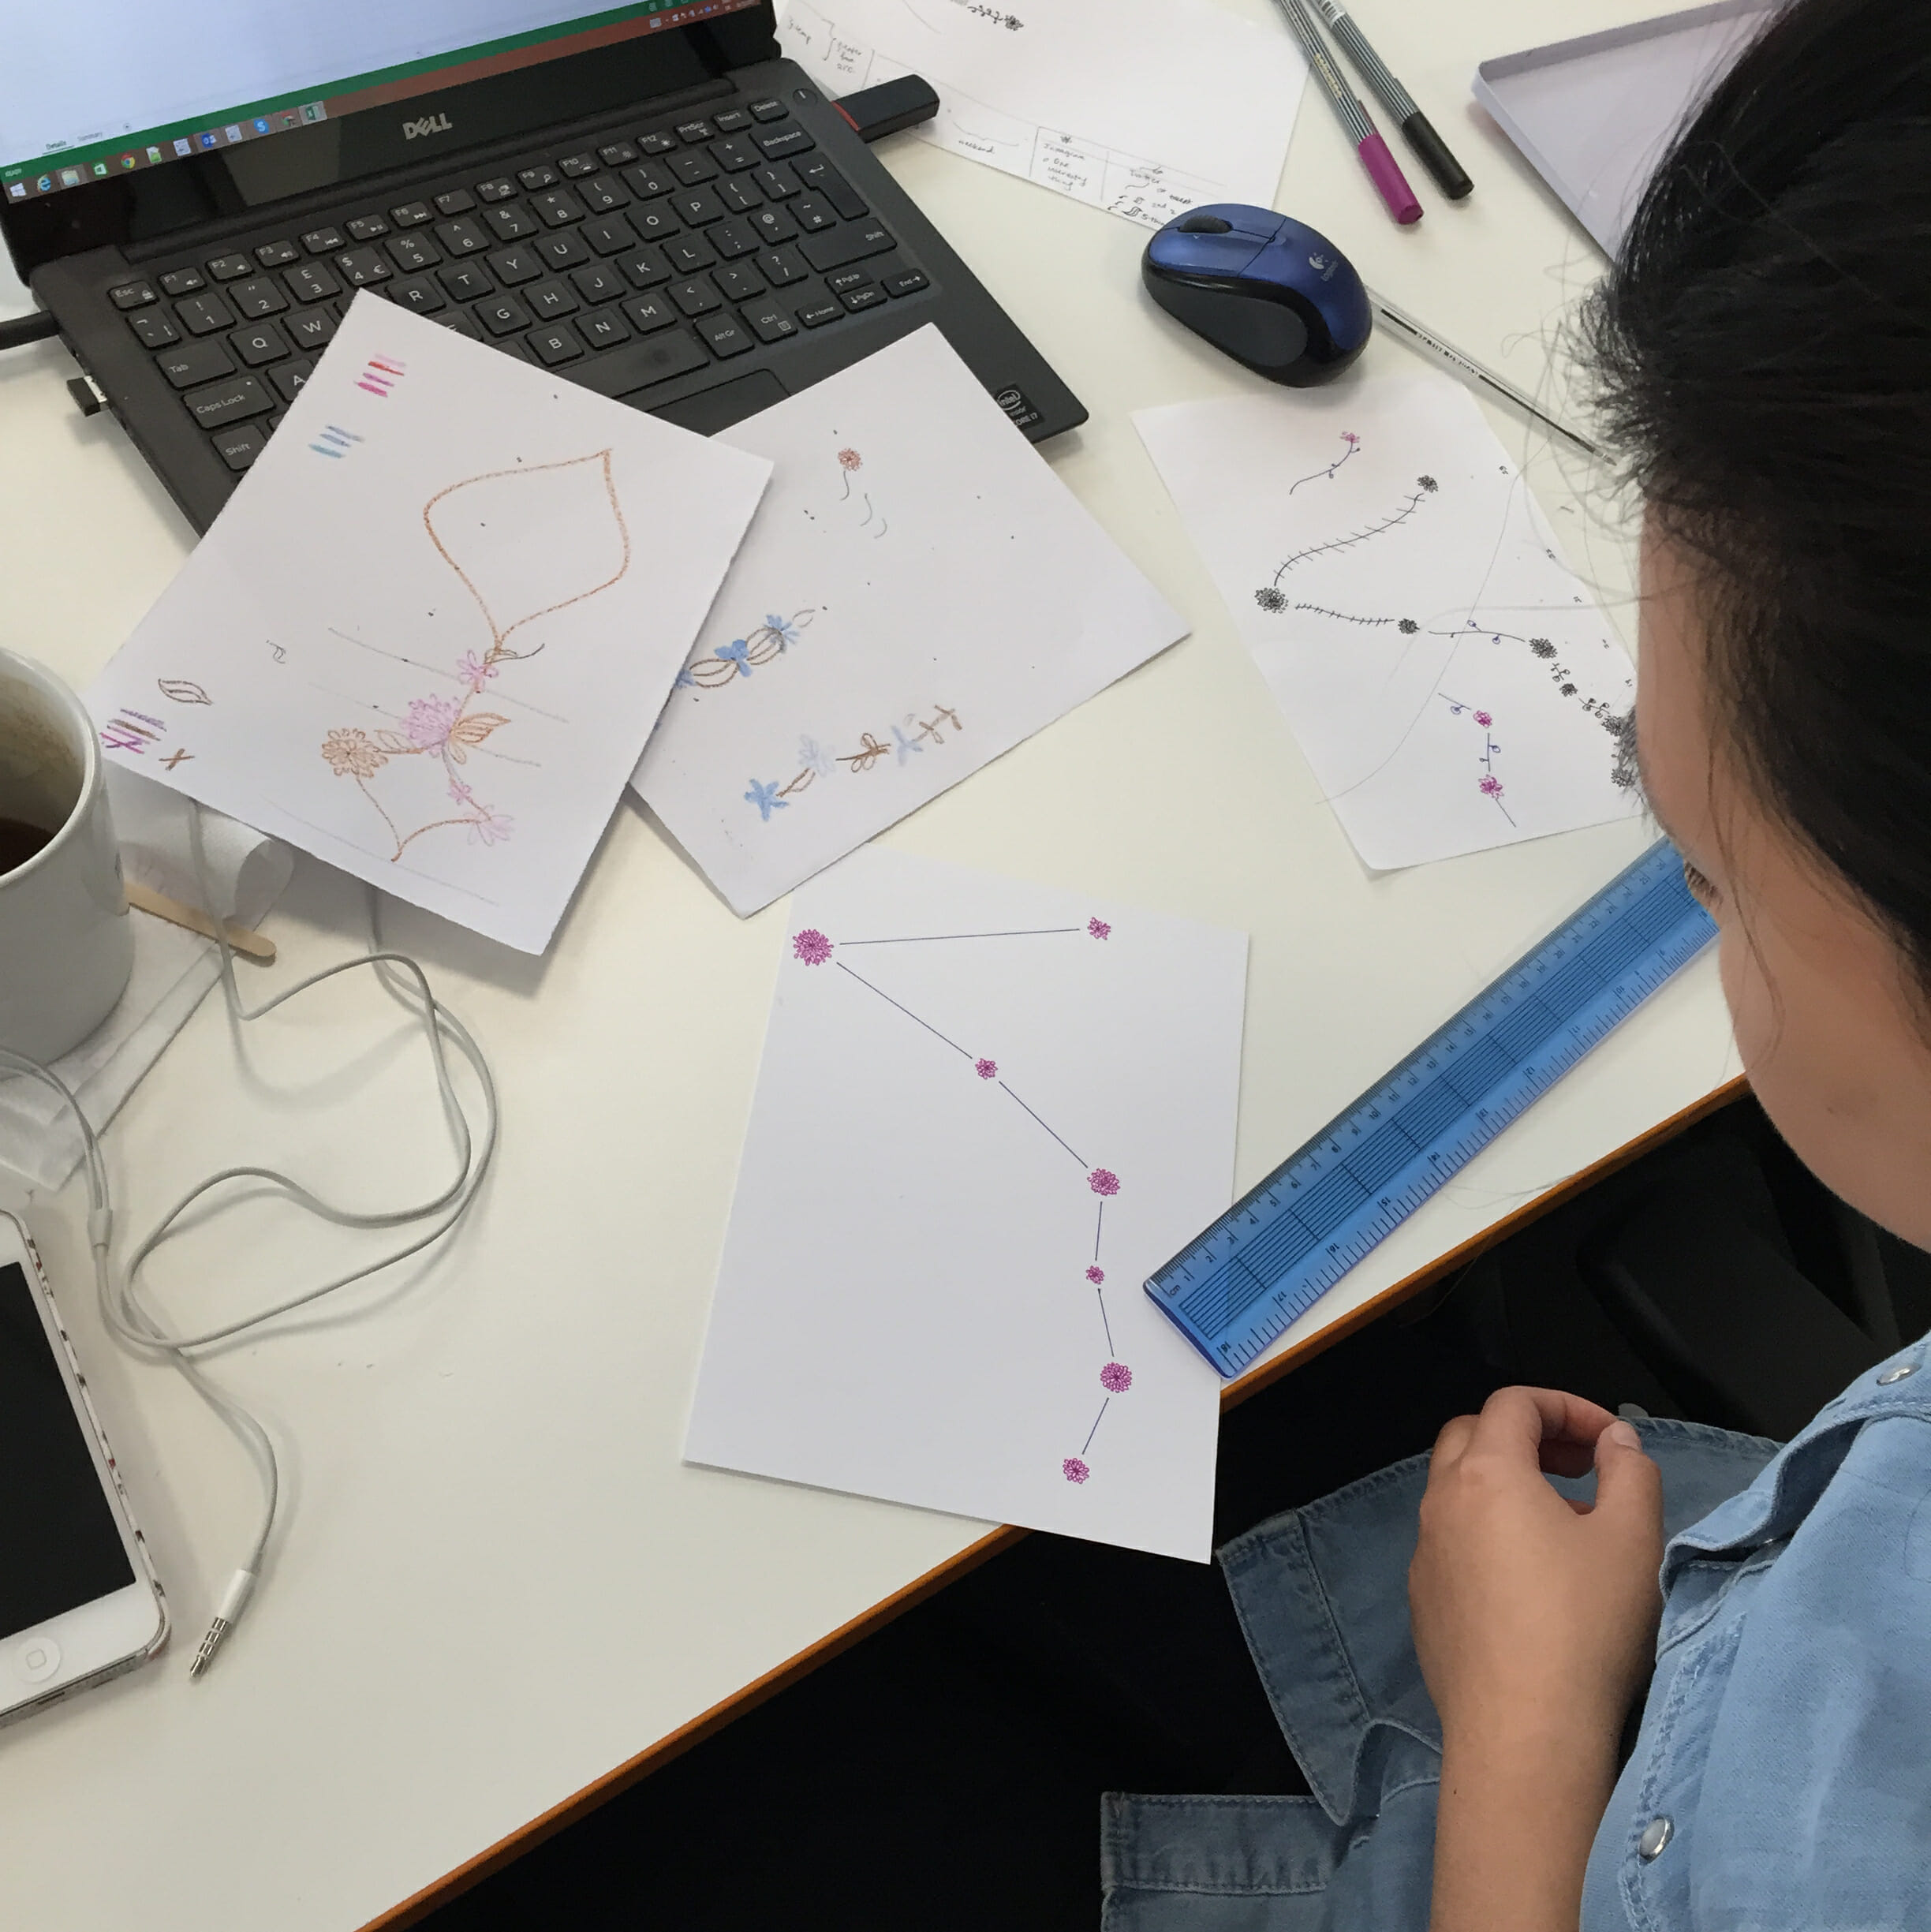
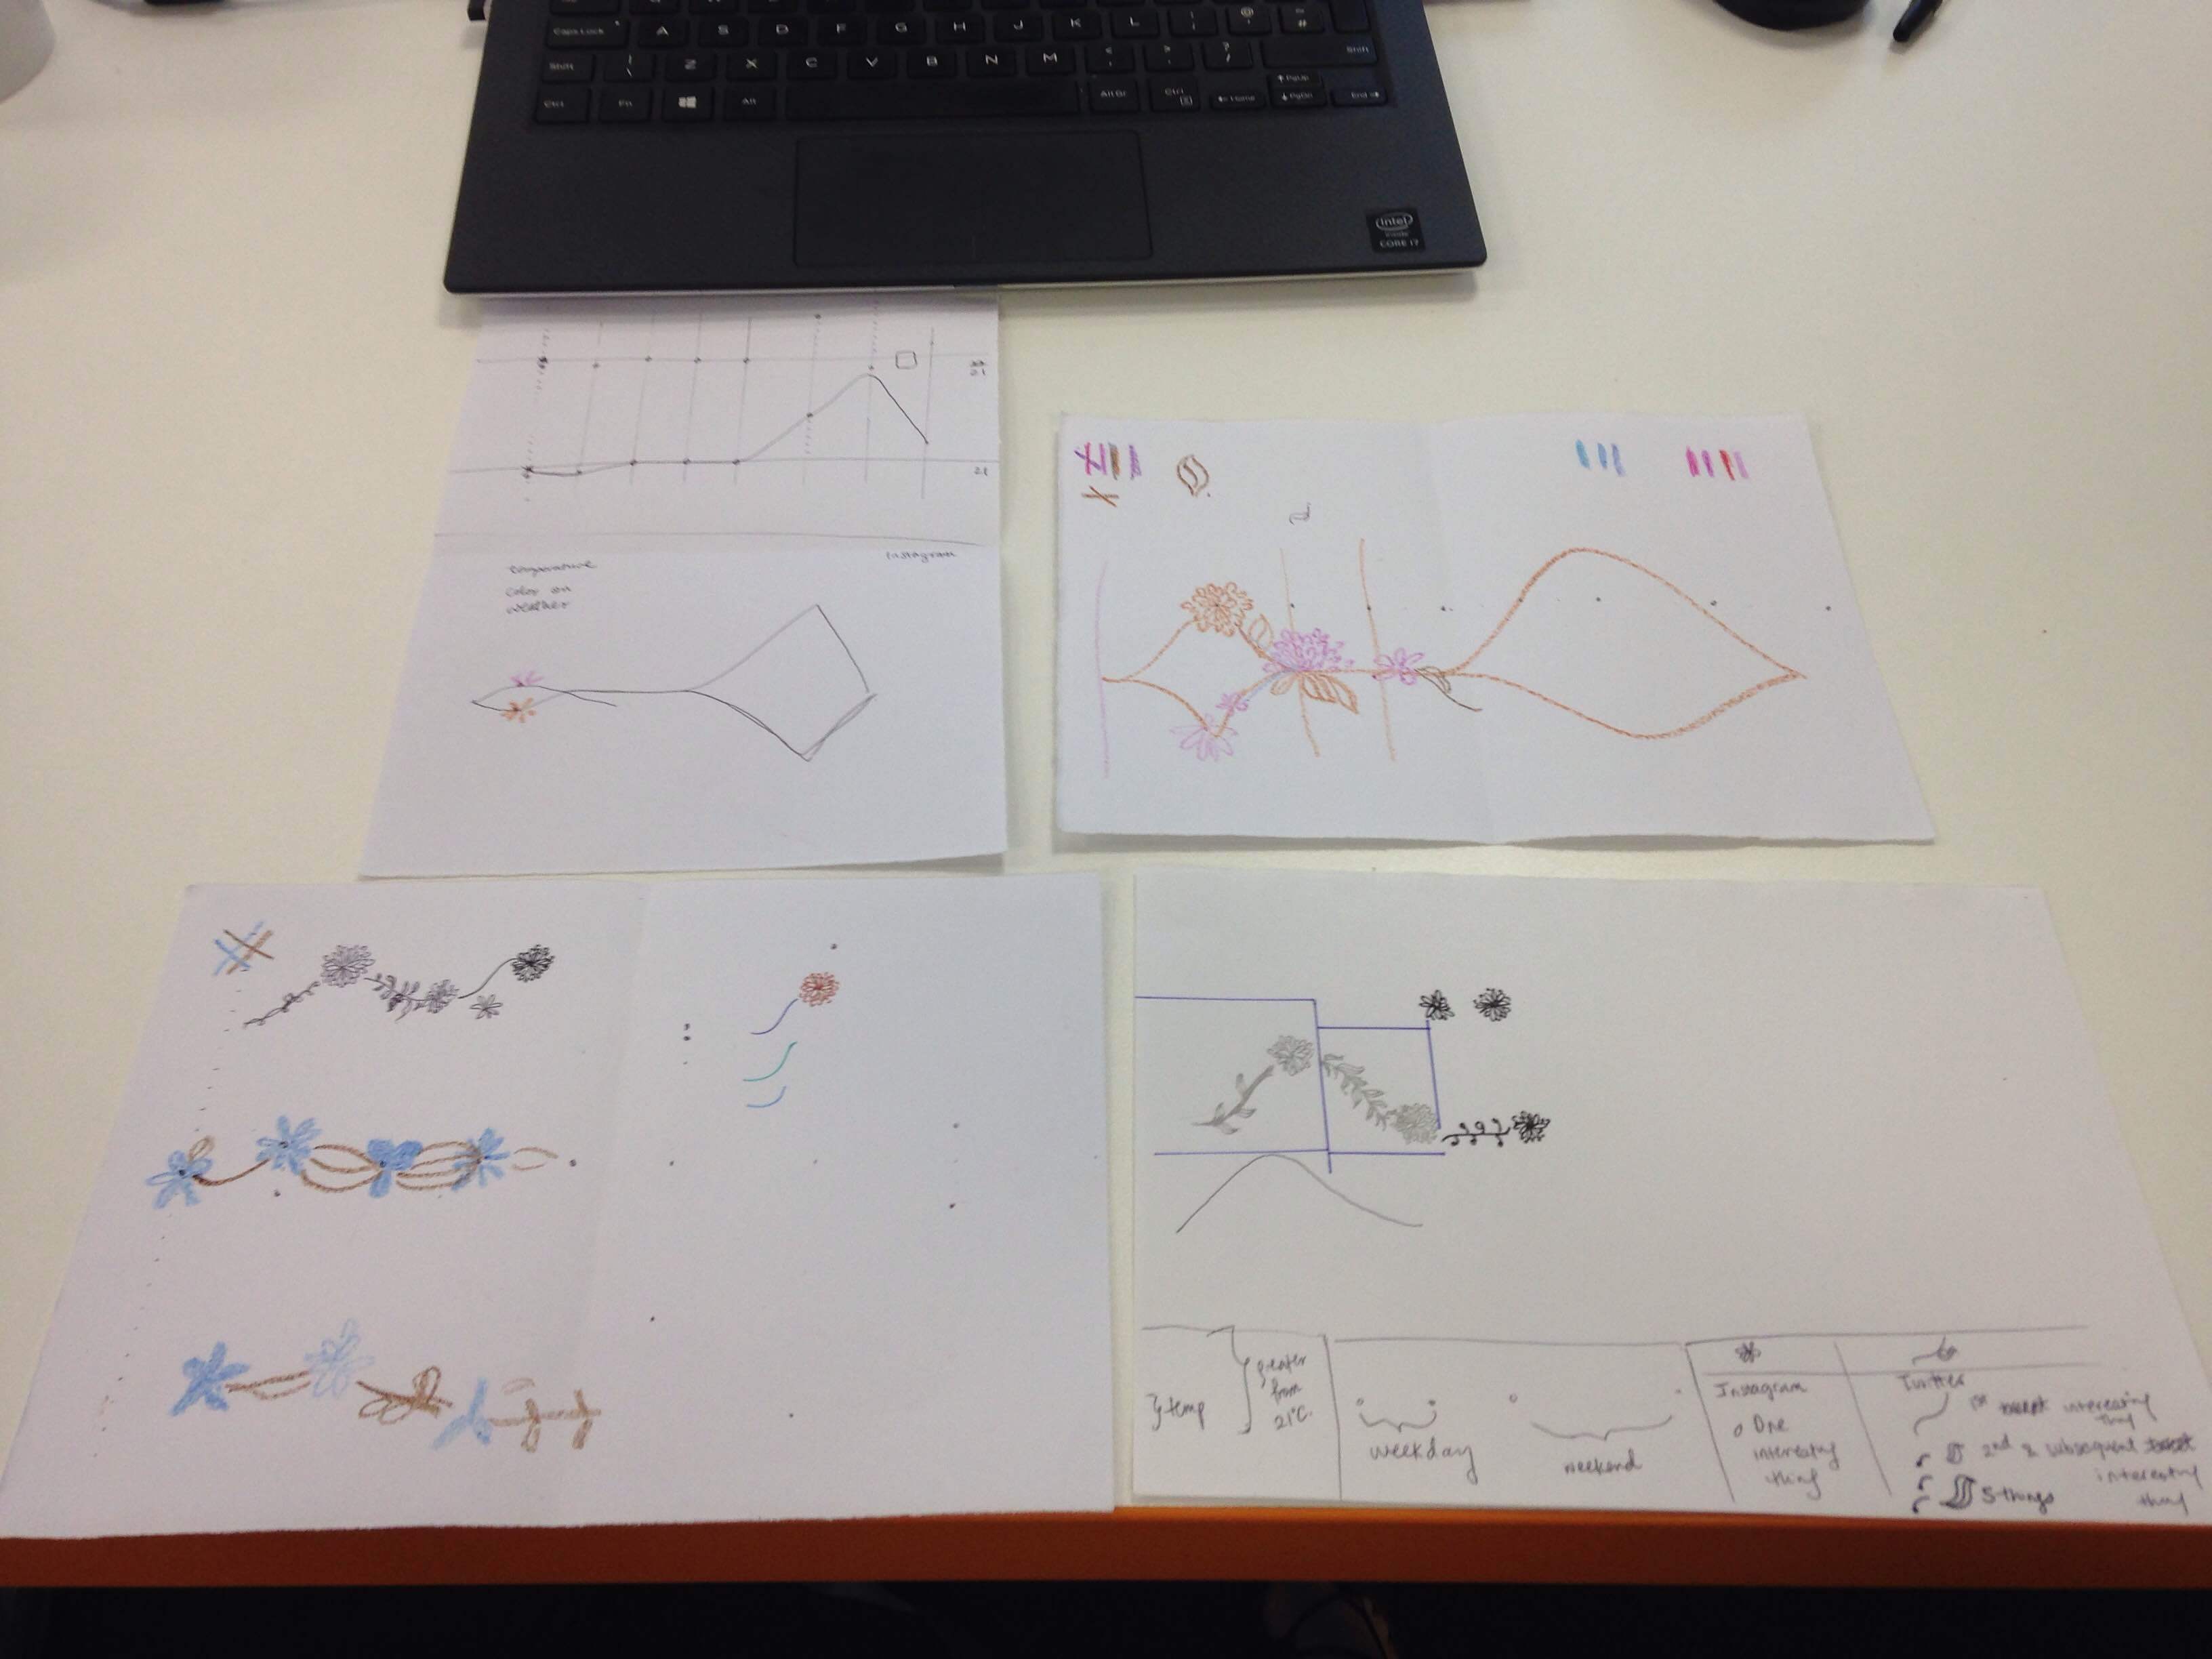
The dataset we were visualizing was the number of times Andy found something interesting in Instagram or Twitter over 1 week. It’s not a lot to go on so I researched Andy’s Twitter and Instagram feeds for themes and looked up daily temperatures. I noticed that his Instagram feed was filled with nature so I decided on a flower and stem theme.
Additionally, I just love the delicate styling in the original project that I thought I’d give it a go. Some of my colleagues took this a technical exercise where they’ve recreated their visualization in Tableau. I’ll take any chance I’ll get to draw and get creative so I took the design perspective playing with color, shape and textures.
There were quite a few iterations– more than I expected. In my 4 drafts, I started with the wireframe of temperature over a week, then moved onto color and flower sizes, then materials (crayon, pencil, pen, fine point marker). I also ended up playing around with straight and curved lines in the final version ( luckily, I didn’t make a mistake and have to redo my postcard).
Here’s my final postcard!
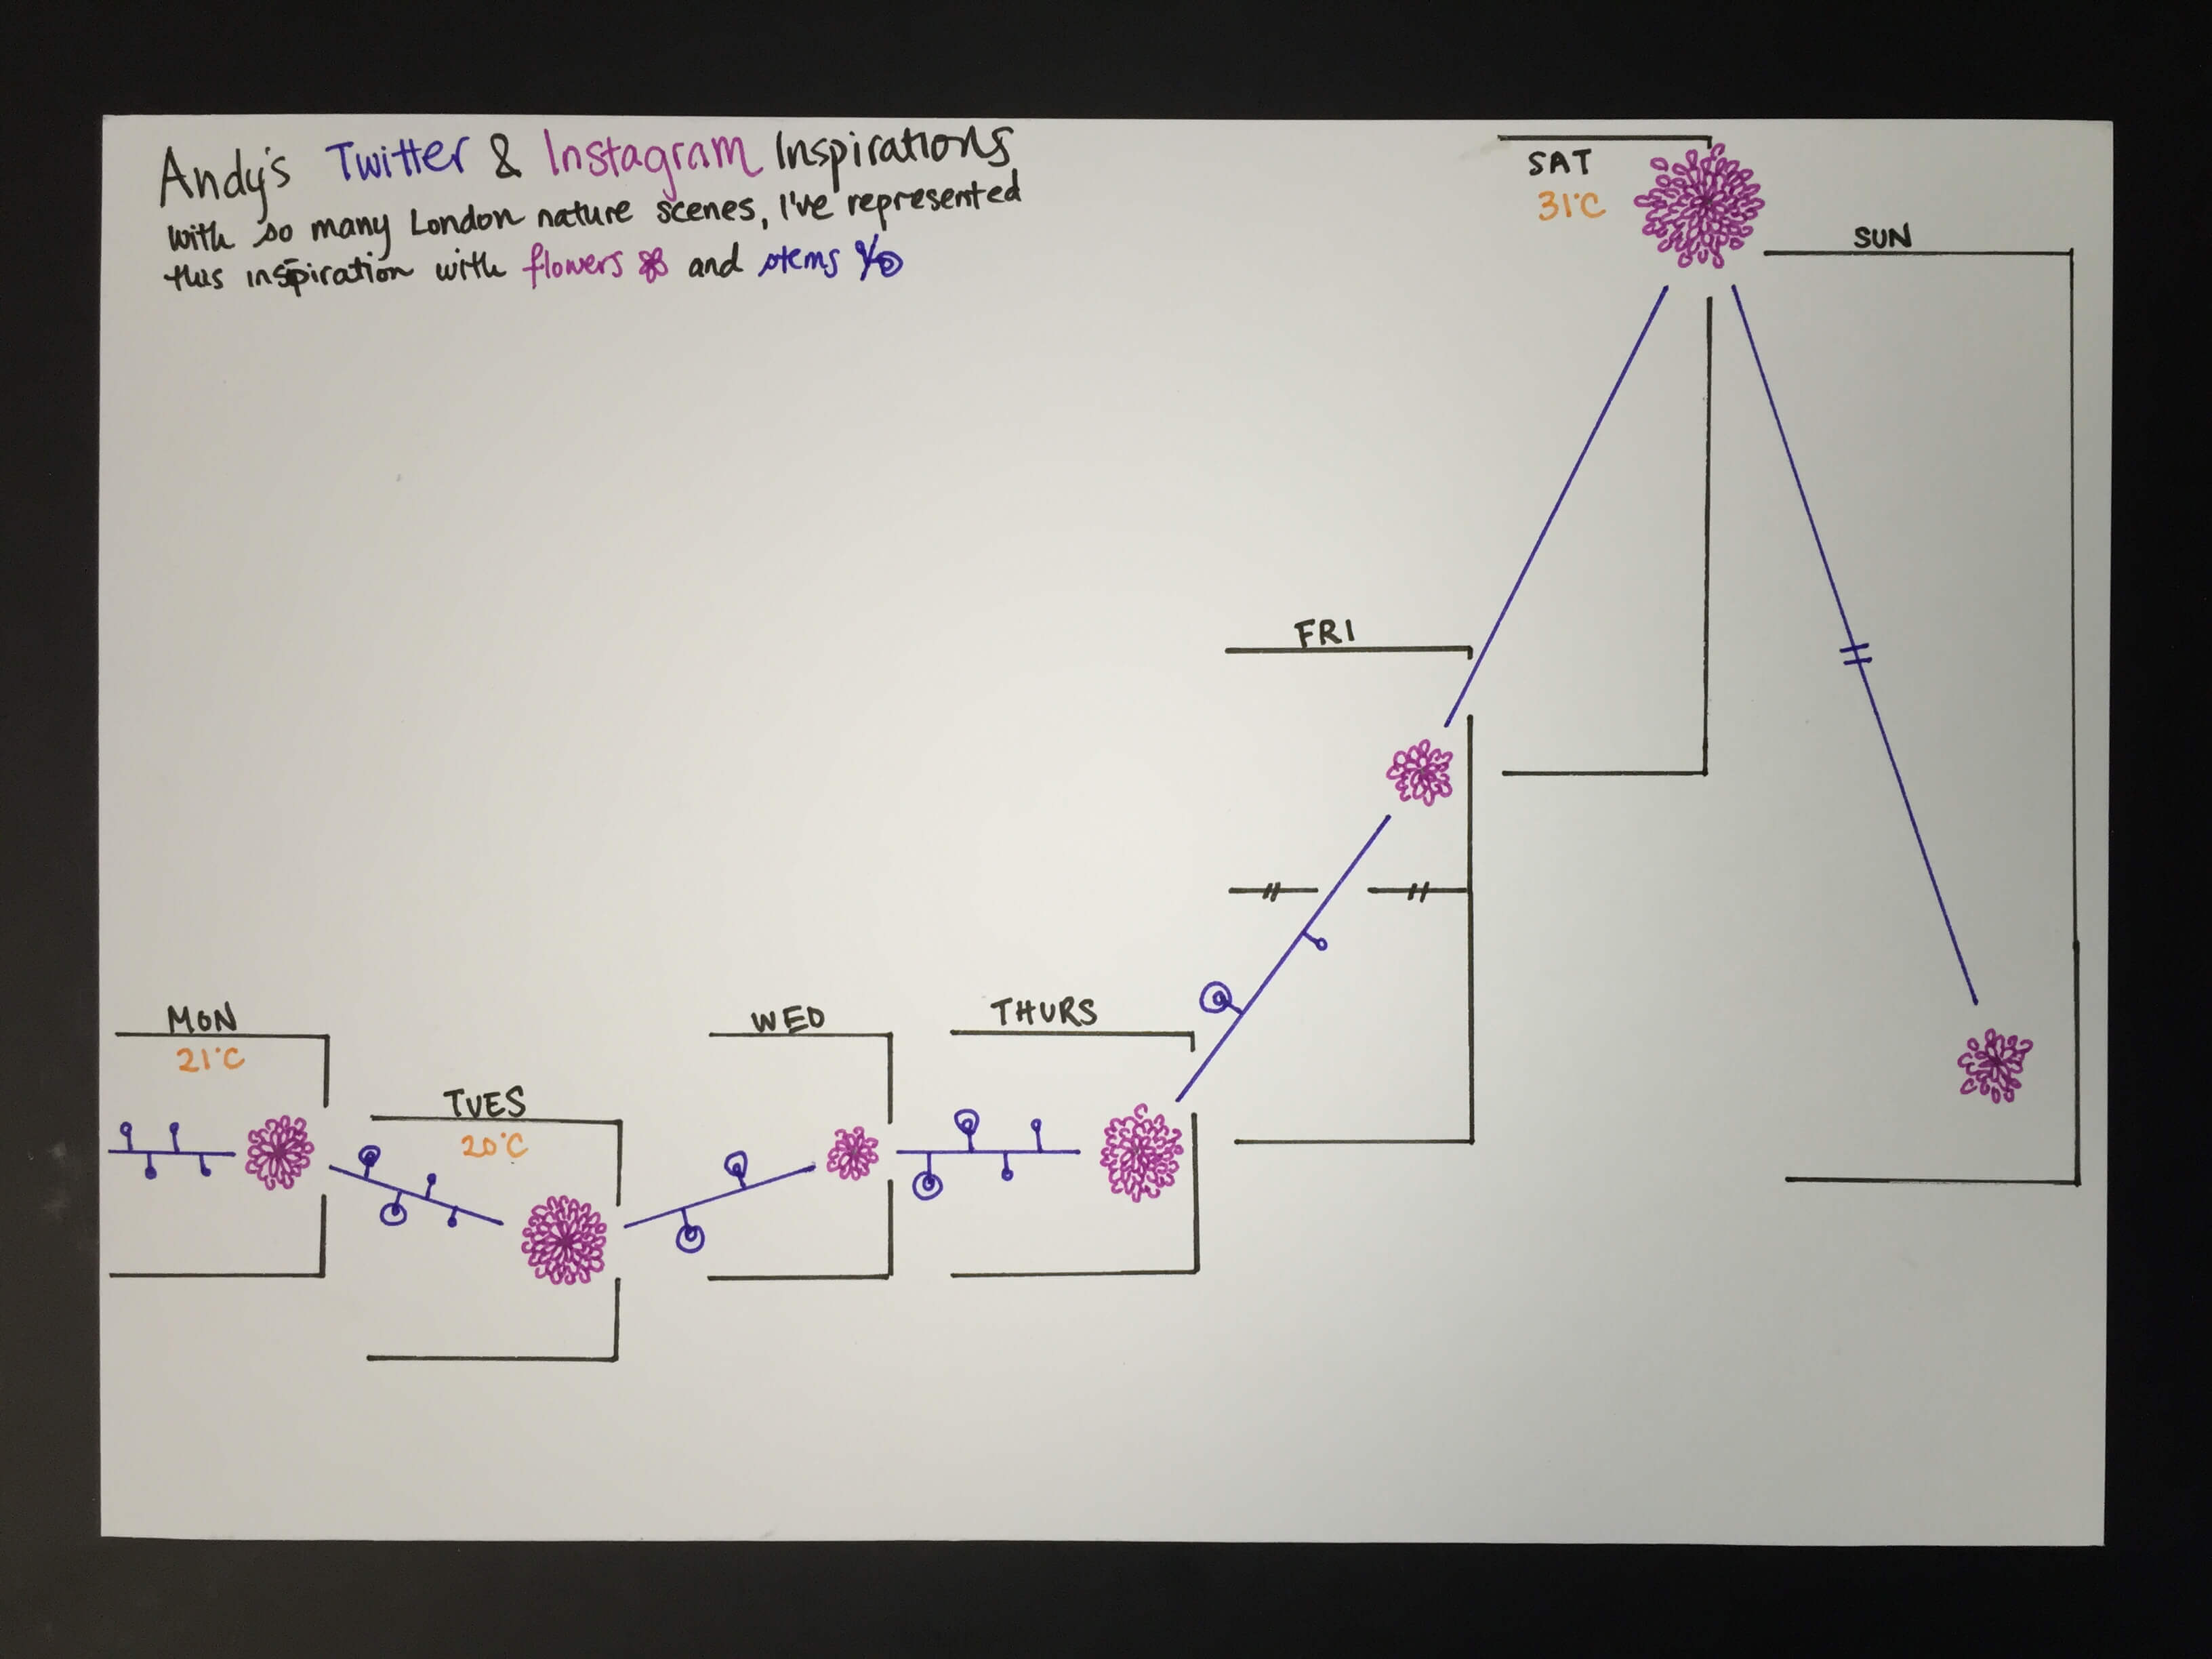
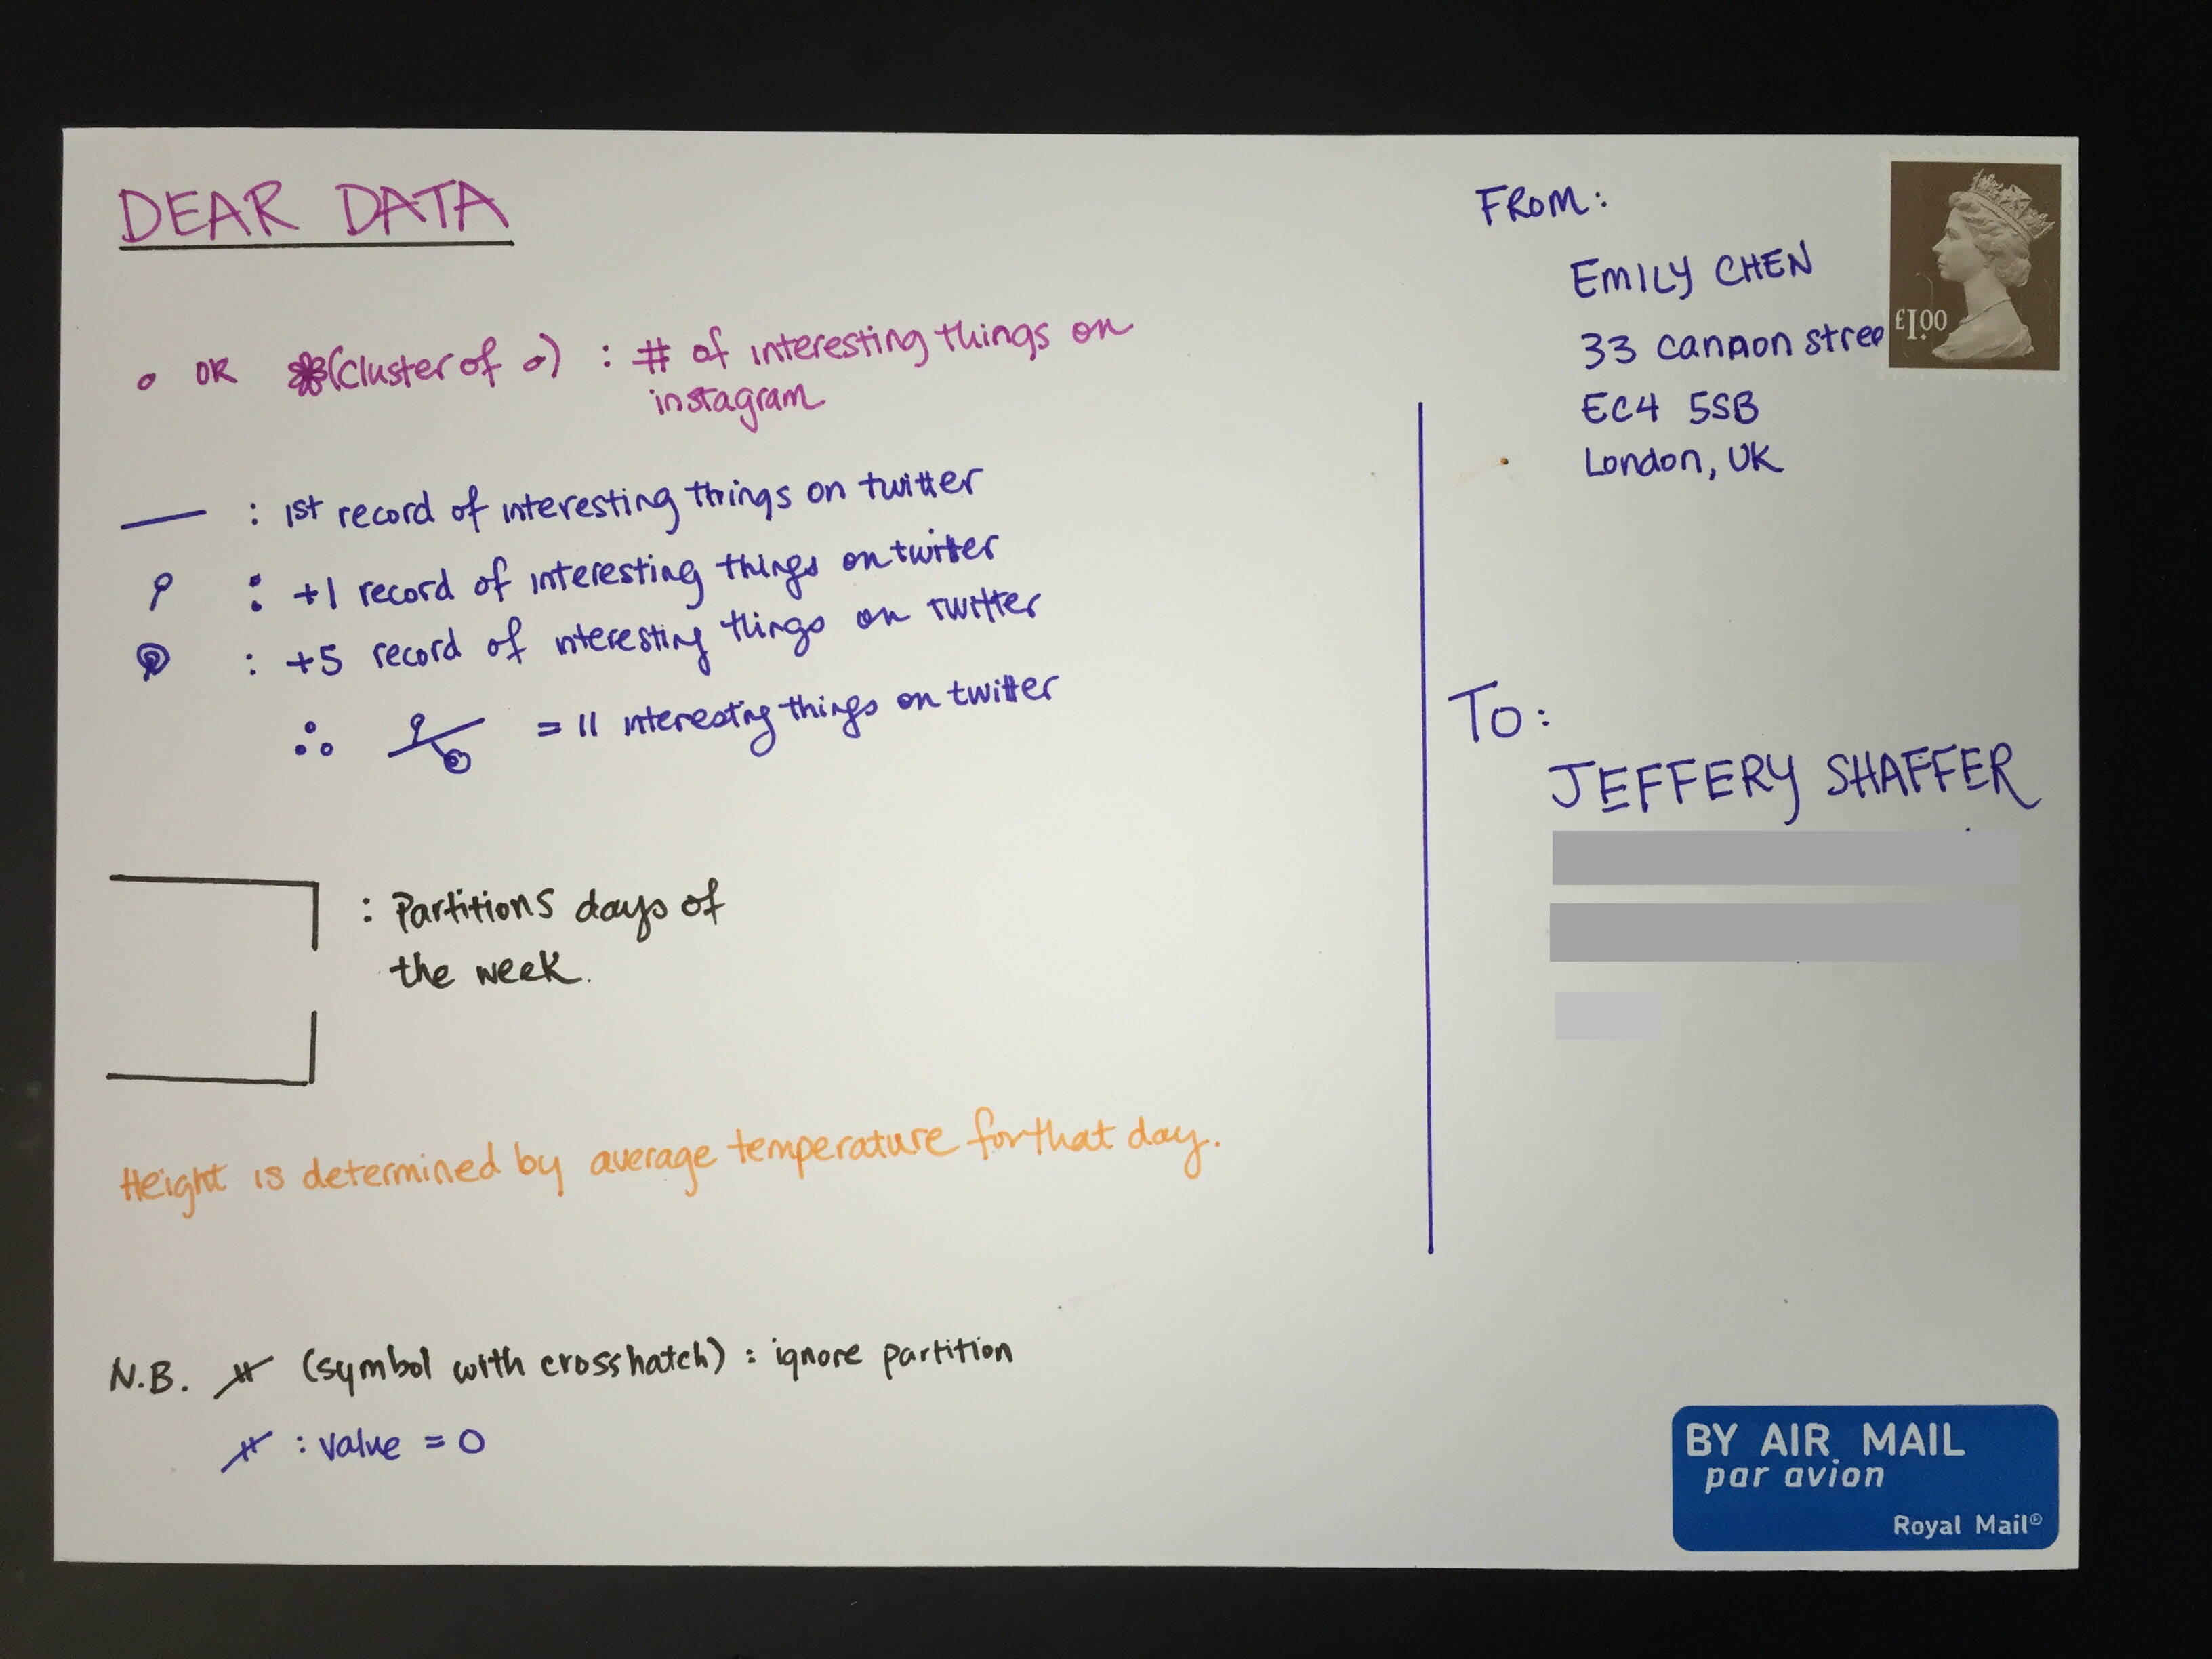
My legend is color and shape coded but due to space, I had to figure out a way to represent more data points efficiently. Hence a new symbol for +5 records for Twitter!
Originally, I hadn’t given any thought to how people will understand that these are days of the week (blinders I know). I tried to create partitioning without clutter. You can send me a message to let me know if I was successful in that!
Let’s hope Jeffery likes it!