


Hiding vs excluding in Tableau is not something I had really considered before, because it’s not something I had used much. But it came up in training the other day and it turns out:
The difference between these two is really important if you’re using table calculations!
- HIDE – will keep the marks in the view but makes them invisible. Hidden marks are included in the table calculation.
- EXCLUDE – will filter out the marks before applying a table calculation. The excluded marks are not included in the calculation.
EXAMPLE
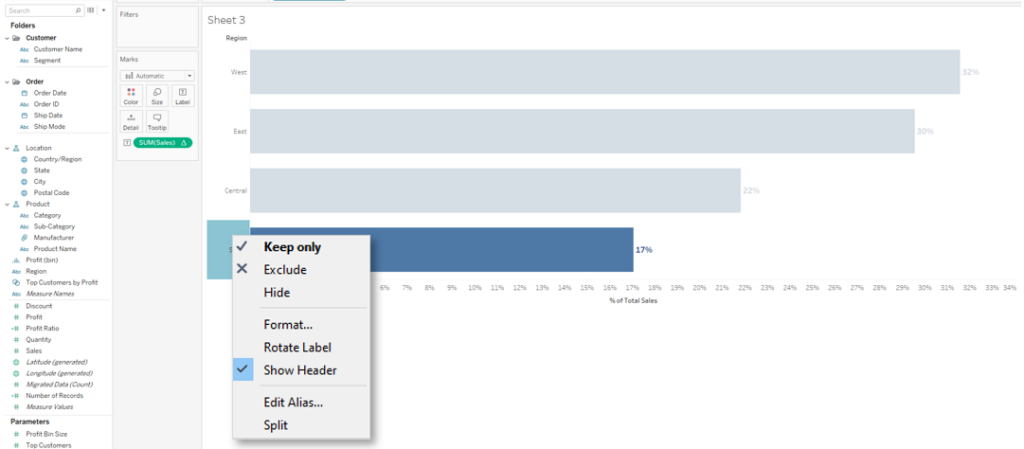
The option to ‘Hide’ or ‘Exclude’ will appear in a drop-down menu when you right-click on a dimension value in your view. In this example, my ‘Region’ field is a dimension with 4 distinct values: West, East, Central and South.
If we consider the Percent of Total table calculation, each value is compared to the total sum of all the marks in the view.
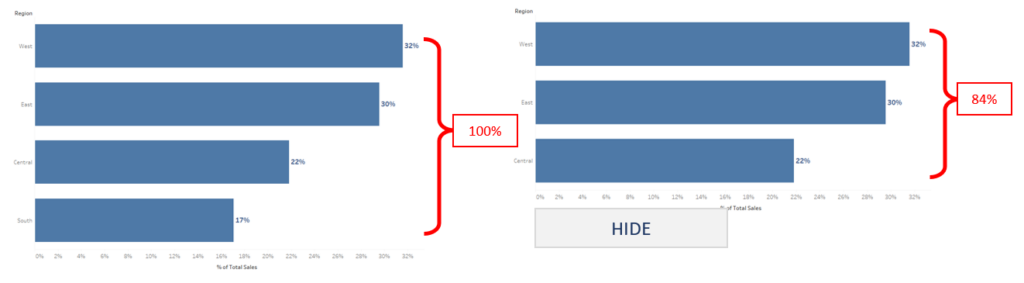
HIDE – Percentages are calculated before the marks are hidden.
The total sum of all the marks in the view includes those that are hidden. The percentages stay the same BUT this means that the remaining percentages that are visible will no longer add to 100%.
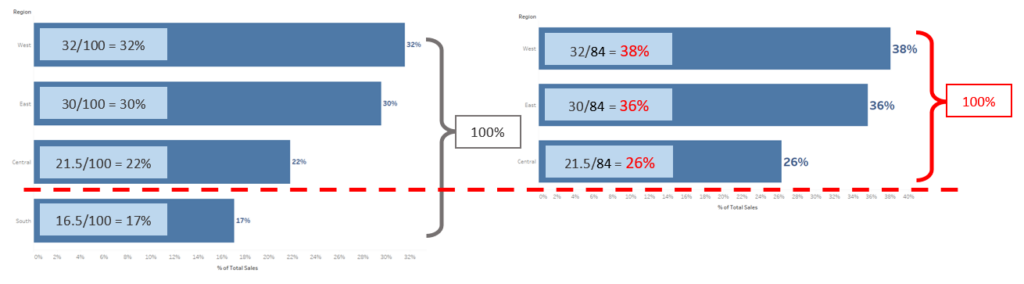
EXCLUDE – Percentages are calculated after the marks are filtered out.
The percentages still add to 100%. The three remaining percentages are larger since the values are compared to a smaller total (which no longer includes the excluded values).
Which one should I use? That’s the carefully considered decision you have to make as an analyst. They both exist because they are both useful in different situations. Some ideas:
- Do you want the visualization to take into consideration all the data, but only showcase certain values? (HIDE)
- Or do you want to get rid of values altogether or ignore them? Are they outliers, are they irrelevant to your analysis? (EXCLUDE)
I hope this blog has given you enough understanding to help you make those decisions, if you ever need to.