


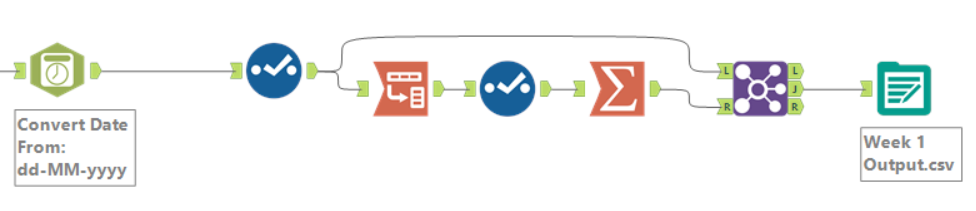
The following will be an Alteryx solution to the Preppin’ Data 2019: Week 1 Challenge. If you haven’t already, go check out the challenge and the associated input data here.
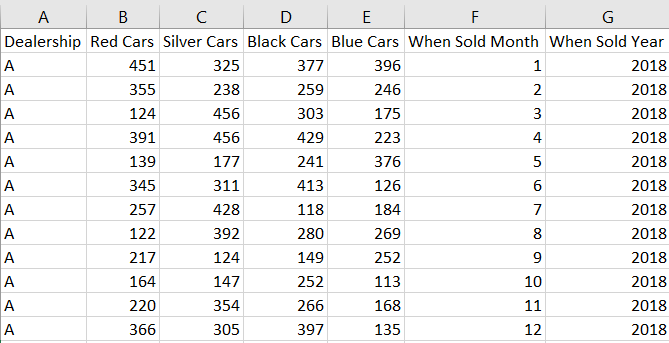
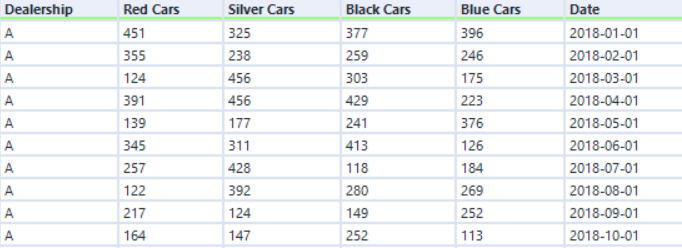
To recap, the challenge was to turn this dataset:
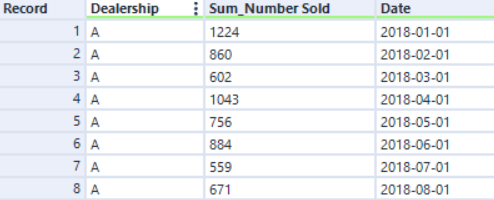
Into this:
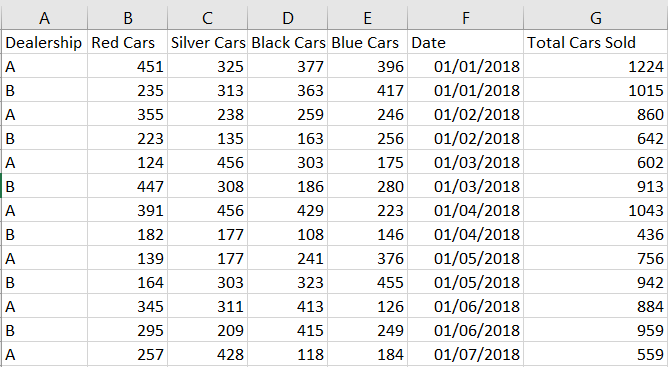
In a manner which would be flexible enough to deal with new car colour columns in the future.
Step 1: Convert the ‘When Sold Month’ and ‘When Sold Year’ columns into a single ‘Date Sold’ column
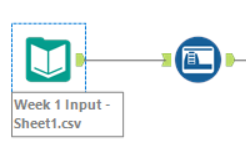
After using an Input tool to bring in the data, we want to connect an Auto Field tool. This ensures that if any new car colour fields are added, their datatypes will automatically be changed to an integer.
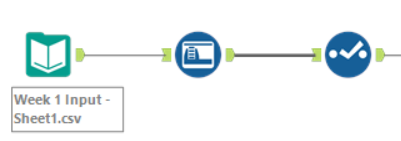
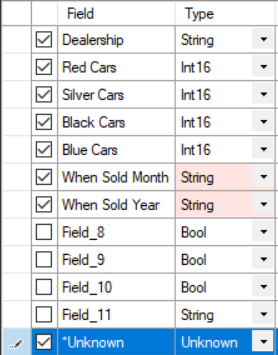
Next we want to connect to a Select tool and change the datatypes of our ‘When Sold Month’ field and ‘When Sold Year’ field to a string. We do this to ensure we can properly create a date string in the formula tool to which we connect next. It is also important to tick the unknown field to ensure that if a new car colour is added, it will be included in the workflow.
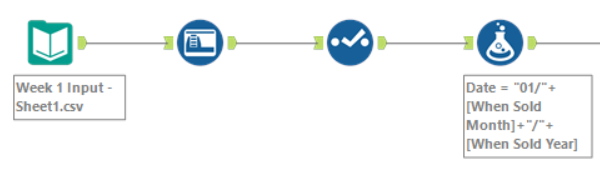
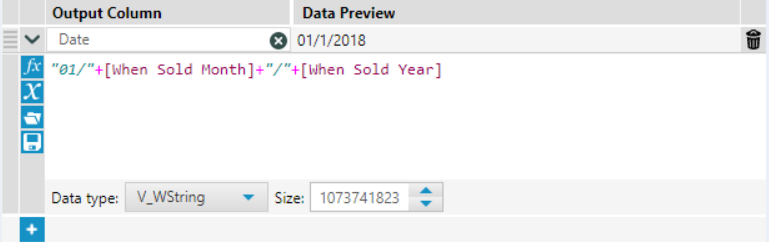
Within the Formula tool, we want to output a new column, which we will call ‘Date’. Since the dataset does not include a specific day on which the sales occurred, we will just use the 1st day of each month to construct our date field. Hence, we use “01/” at the start of our formula and add it to the month string and year string with another “/” as a separator.
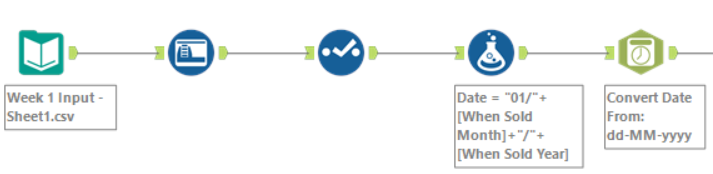
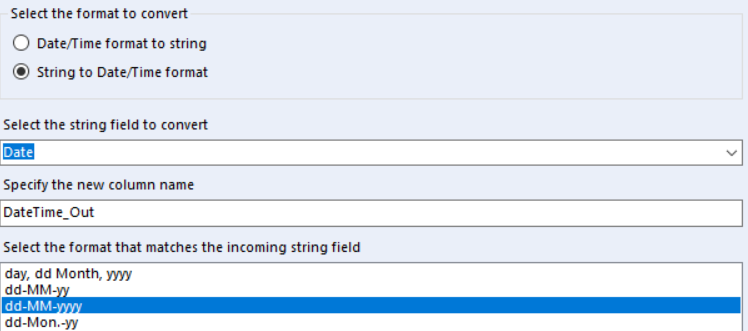
To convert this newly created date string into something Alteryx actually understands to be a date datatype, we connect to the DateTime tool, select that we want to convert from a string to a date, choose the ‘Date’ column we just created, and specify that the incoming string field is in the dd-MM-yyyy format. Don’t forget to then connect to a select tool and deselect the old date columns, and change the datatype of our new date field to… you guessed it, date.
By now, your data output should look something like this:
Step 2: Create our total number of cars sold column
The next step is to create a column showing the total number of cars sold in each dealership in each month. We could do this by using a simple formula tool that just sums the red, silver, black and blue car fields. However, doing this will mean that if a new car colour column is added, its sales won’t be included in the total sales number. Therefore, we need to create a workflow that can provide the flexibility for new car colours.

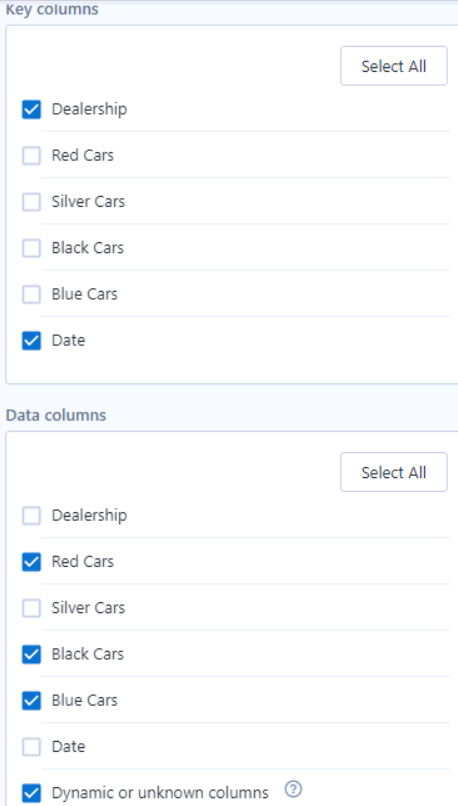
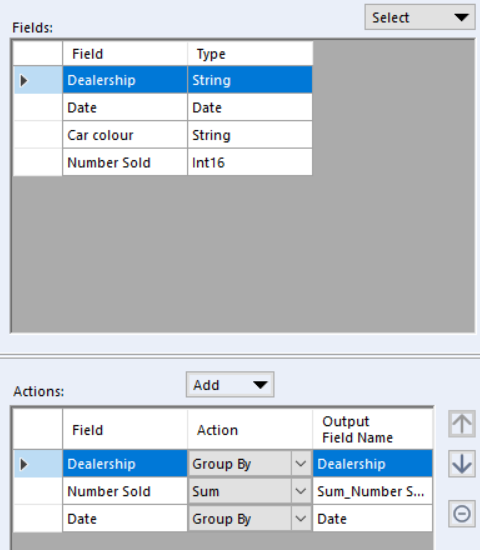
One way to create the total cars sold column in a way which would accept new columns is to transpose the car colour fields and ‘Dynamic or unknown columns’ and then use an aggregation tool to sum the car sales and group by dealership and date. The configurations for the transpose tool and aggregate tool should look something like this:
After these tools, the output data should look like this:
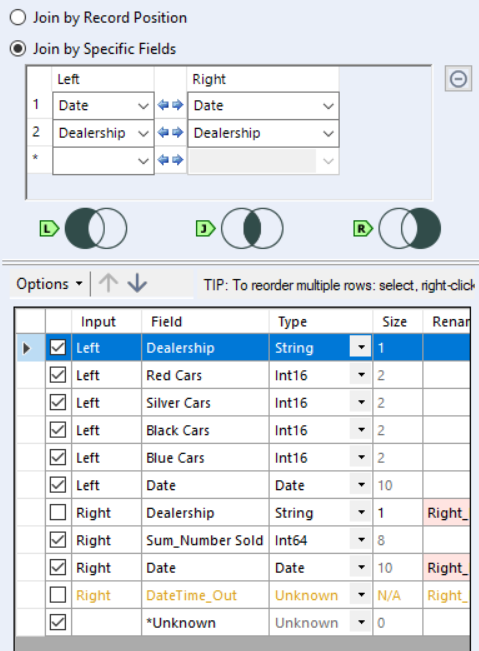
Now we have the sum of sales column, but we’ve lost the columns for each of the car colours, so we need to join those back on from before we transposed. We do this using a join tool that is configured to join by date and dealership.
And that’s it! The output should now match the target output for the challenge.