


Usually, when you build a visualization on Tableau, data is filtered out to create the view. What if you want to answer a question using data that may not be in the view? For example, you may have a chart showing sales by state, but you want to compare those sales to, say, the country-level total sales (which is not in the view). This is where Level of Detail (LOD) expressions come in! LODs allow you to calculate values without being restricted by the level of detail in the view. This is because LOD Expressions look at the data before it's filtered out.
There are 3 types of LODs in Tableau:
- FIXED - compute values using the specified dimensions without reference to the view level of detail—that is, regardless of other dimensions in the view. FIXED LODs ignore all the filters in the view other than context filters, data source filters, and extract filters.
- INCLUDE - compute values using the specified dimensions in addition to whatever dimensions are in the view. INCLUDE LODs are most useful when including a dimension that isn’t in the view.
- EXCLUDE - explicitly remove dimensions from the expression—that is, they subtract dimensions from the view level of detail. EXCLUDE LODs are most useful for eliminating a dimension in the view.
Among these three types of LODs in Tableau, FIXED LODs stand out as especially powerful because they are the only ones that operate independently of what's in the view.
This blog post will focus on FIXED LODs using a couple of examples from the Sample Superstore dataset.
Sales Contribution - % of Total
Imagine we have a map showing sales by state. However, our analysis goes beyond the individual states; we want to compare each state's sales to the country-level total even the view is filtered down to specific region.
To start, we have a map showing the % of sales by state.
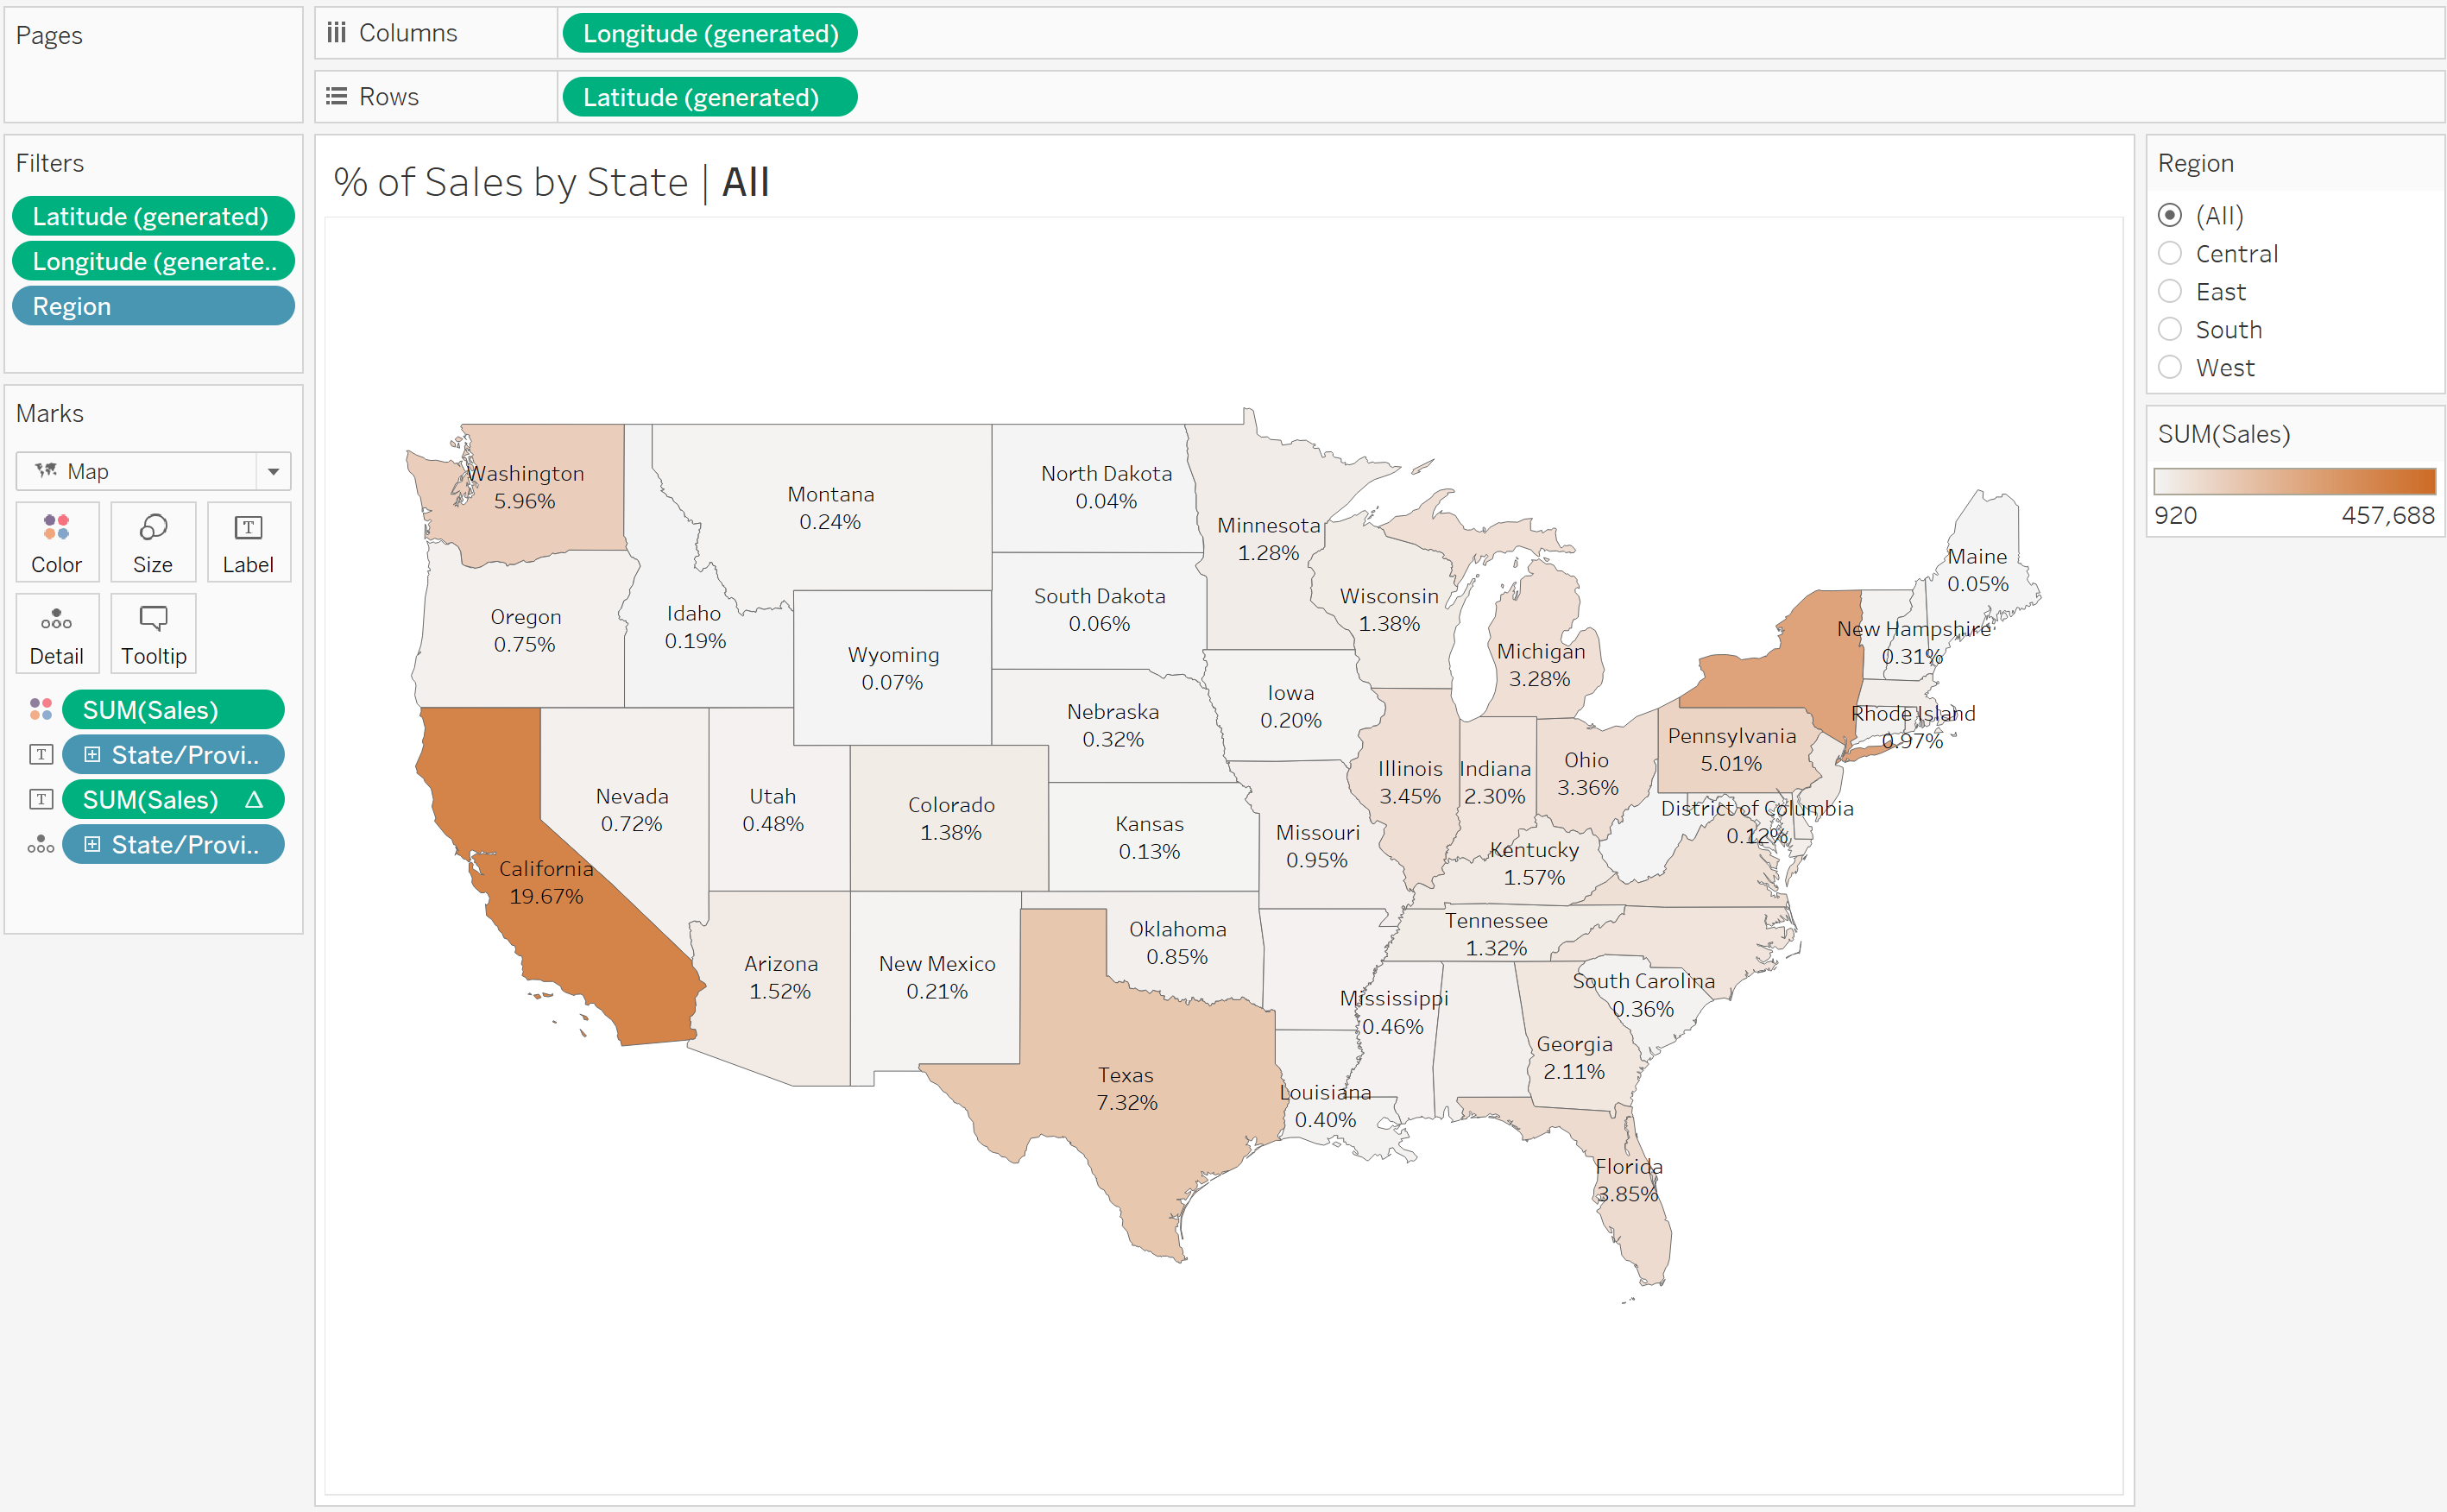
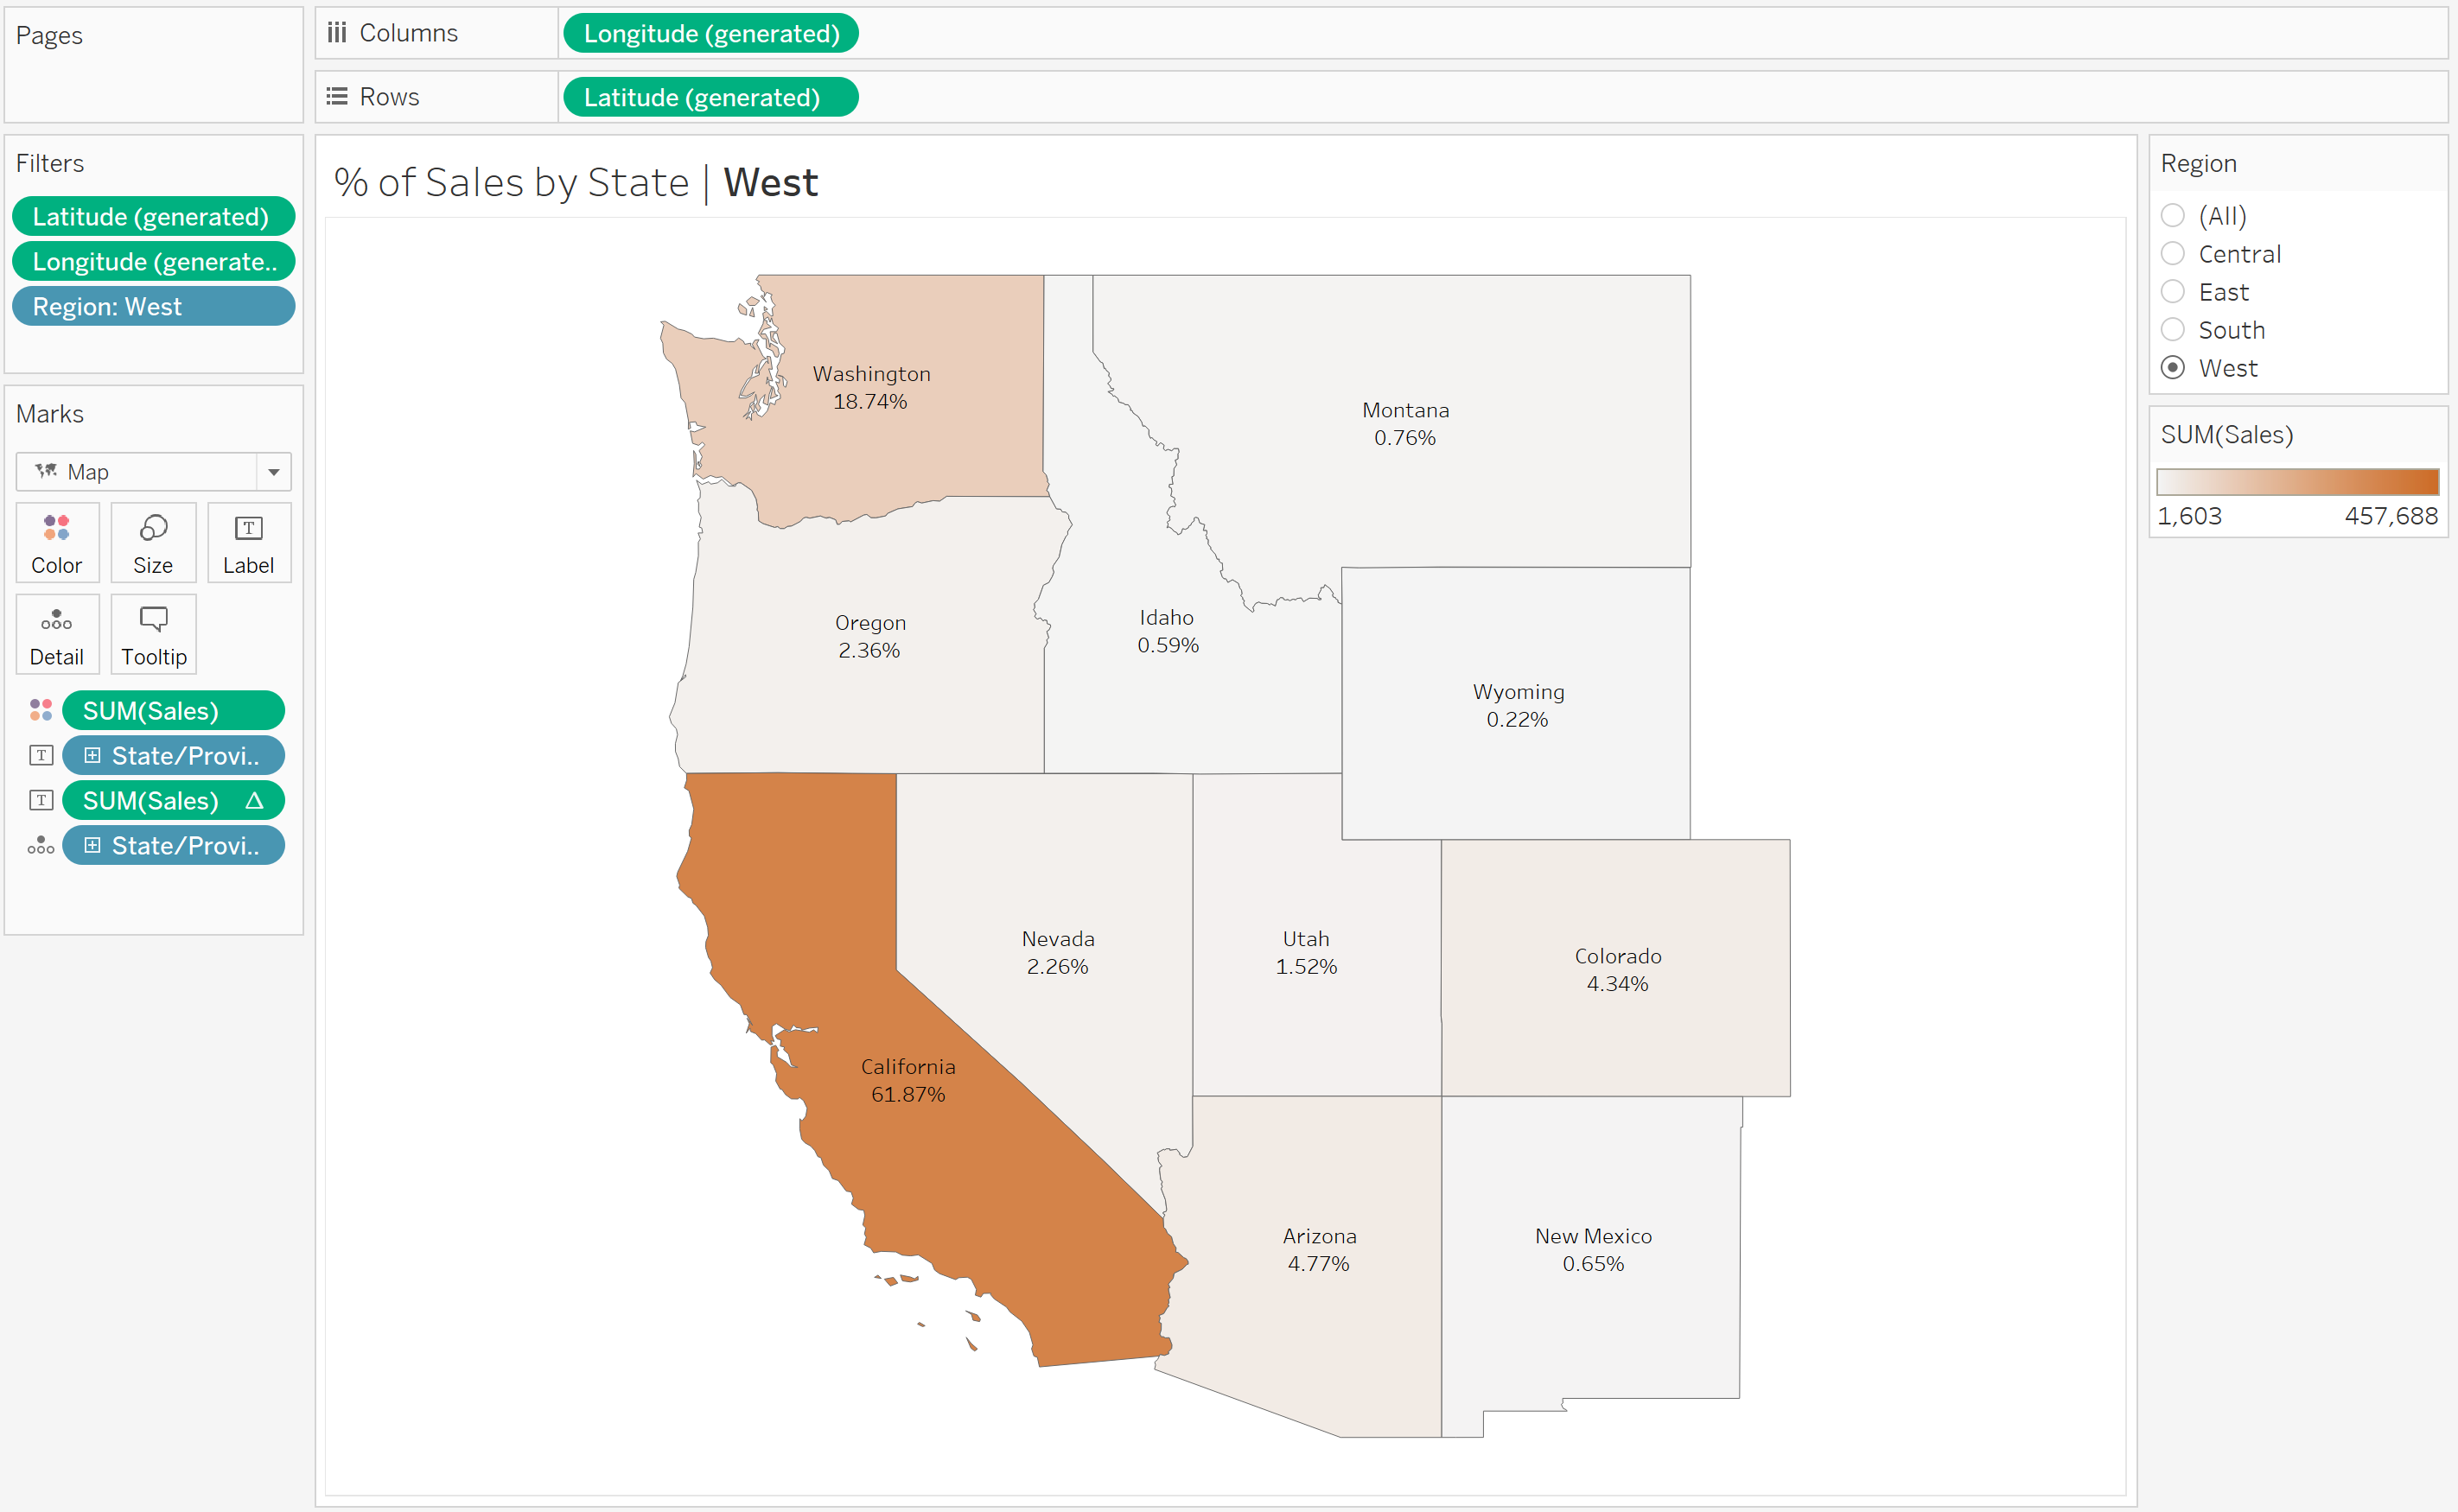
When we filter down to a specific region, the % of sales adjusts to show the proportion of sales as a % of that specific region. Notice, for example that the for Washington, the % of sales has changed from 5.96% (as a proportion of country-level total) to 18.74% (as a proportion of region-level total).
Now, if we wanted to see the % of sales in the country even when the Region filter is applied, we use a FIXED LOD:
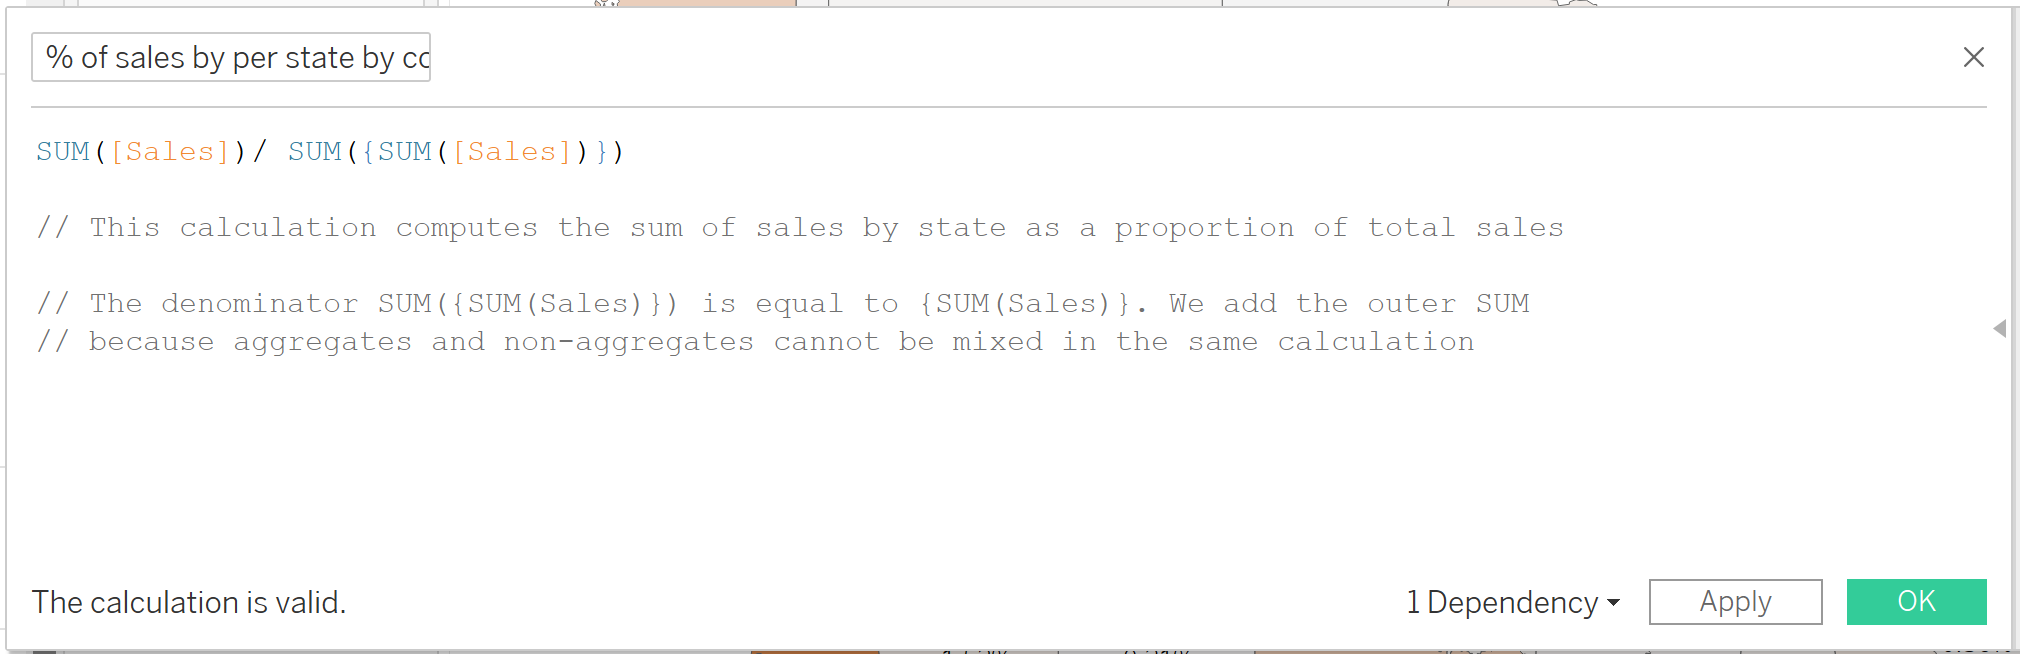
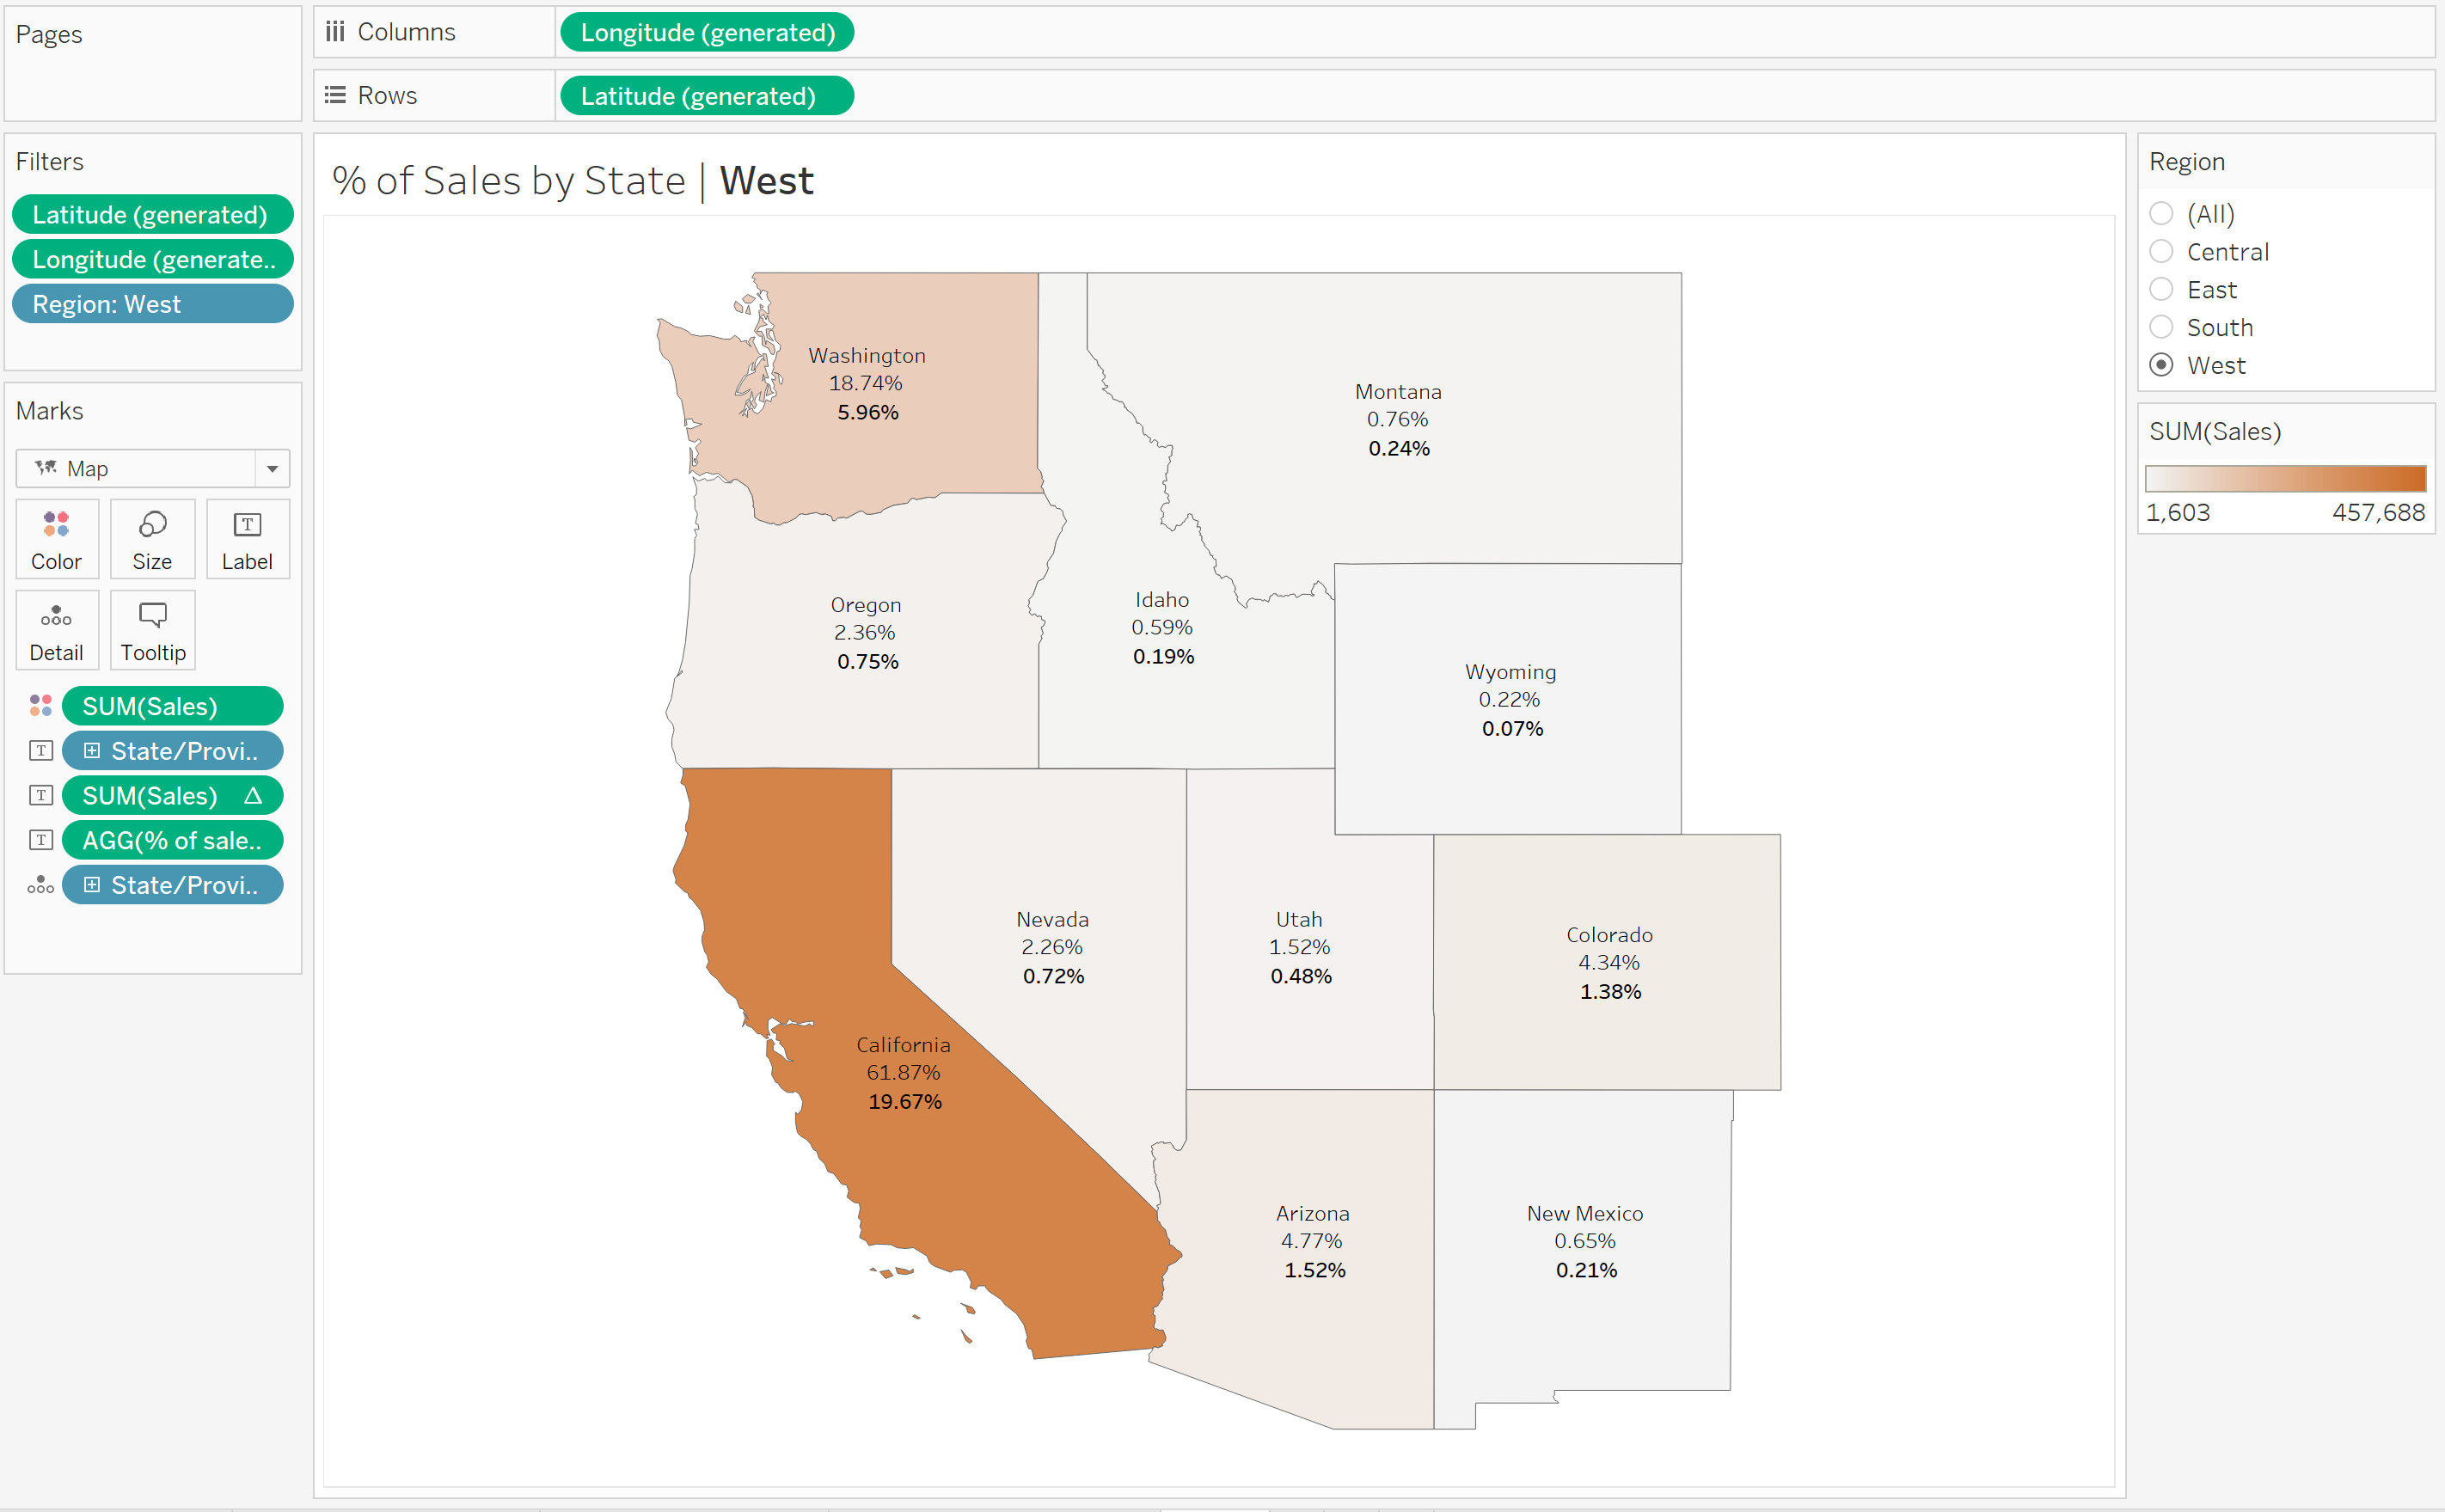
The LOD expression computes the total sales for the country, regardless of the region-level view. When we bring in our FIXED LOD into the view, we now see that even we we filter to the central region, we can still see the % of total at the country level (in bold):
Cohort Analysis - % of New Customers
Moving on to another example, suppose we want to understand the percentage of new customers in each year, irrespective of the current view's dimensionality.
We begin by using a FIXED LOD to determine the earliest order date for every customer:
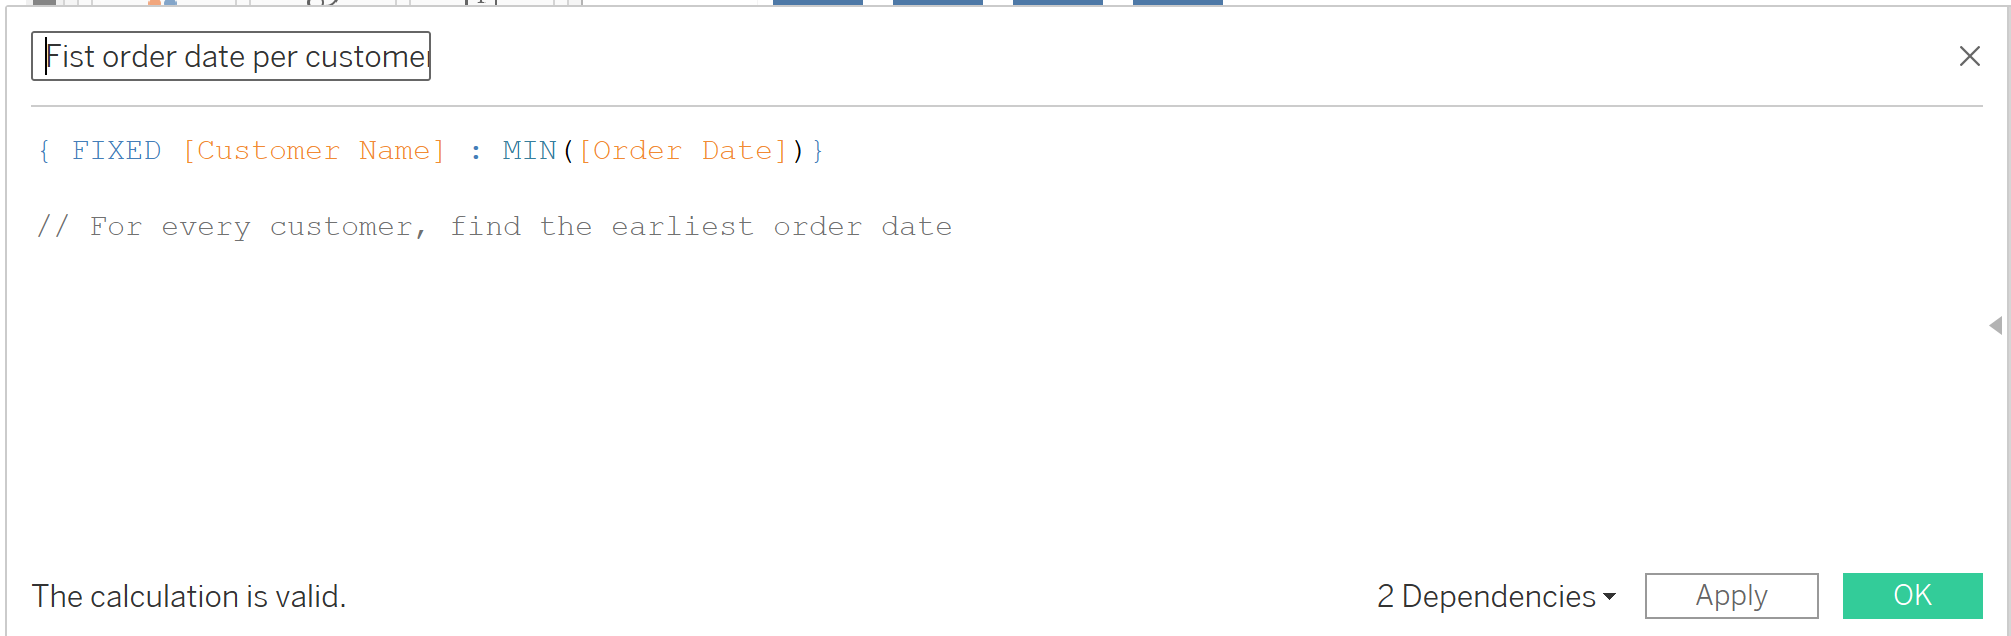
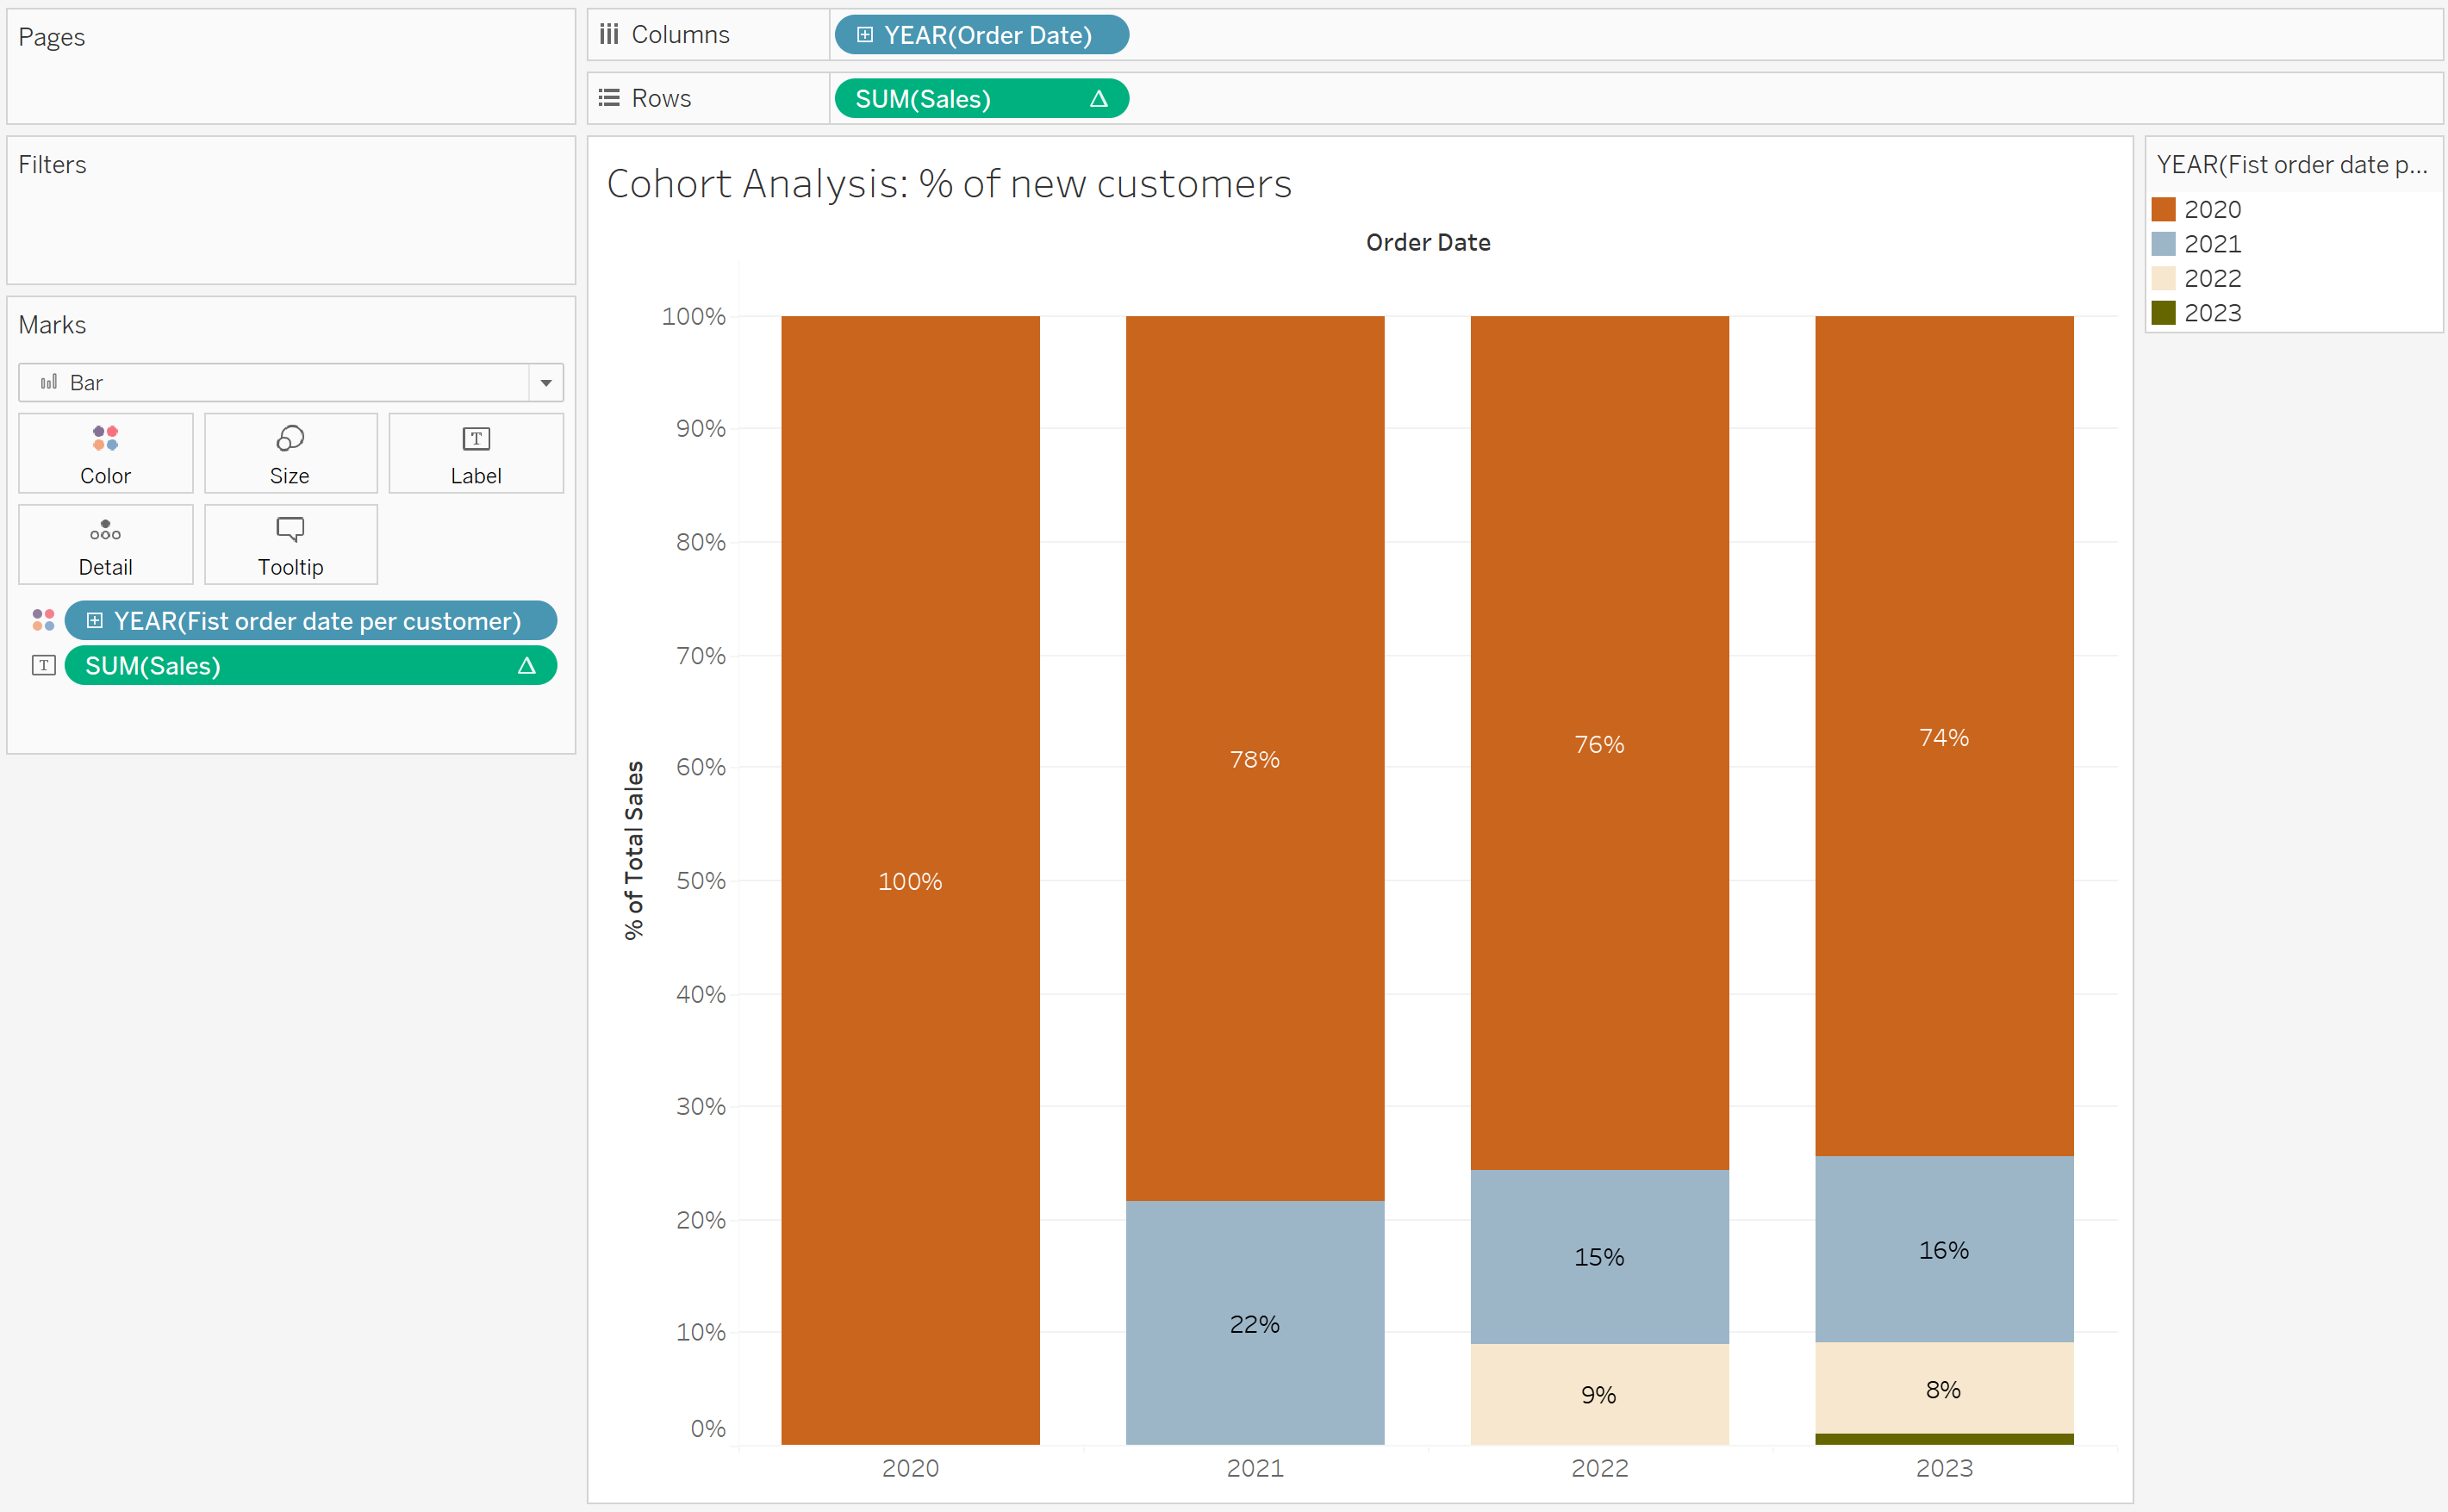
Now, when we bring in our FIXED LOD (which is a date, aggregated at the year level) onto the colour shelf, we can see a breakdown of new customers by year. In 2020, all of the customers were new. In 2023 we can see that, 74% of customers made their first order in 2020, 16% in 2021, 8% in 2022, and so forth.
I hope these two examples have helped you see how FIXED LODs empower you to explore deeper insights by calculating values beyond the limitations of the current view's level of detail.