


In Power BI, source data rarely includes a comprehensive Date Table by default. Often, datasets only contain "transactional dates," which are prone to gaps, such as missing records for weekends, holidays, or days without sales activity.
Relying solely on these fragmented dates is problematic for visualization and analysis. Without a continuous, gap-free calendar, Power BI’s built-in Time Intelligence functions (e.g., SAMEPERIODLASTYEAR or TOTALYTD) cannot calculate correctly, often resulting in broken trends or missing data points in your visuals.
In this blog I will provide you with a solution to that problem! We will leverage the Table Creation features in Power BI to generate a dynamic Reference Date Table. This table acts as a continuous calendar, spanning the entire range of your dataset without a single missing day.
In data modeling terms, this technique is known as Date Scaffolding.
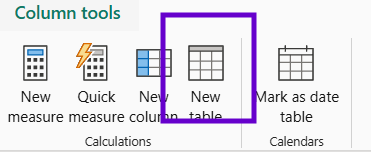
- First, create a new table in your Table View:
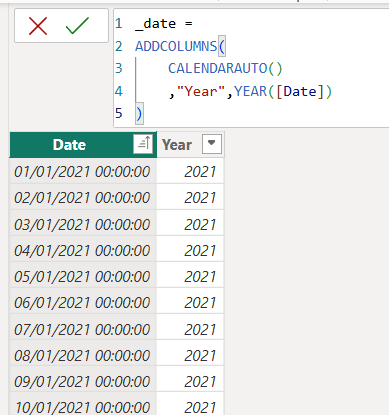
The DAX code for this table should be:
_date =
CALENDARAUTO()
This new table uses the dates in your model and repopulates the gaps. This will change according to how frequently the data updates.
- To create an additional column for 'Year' you need to go into the table DAX and wrap that inside an ADDCOLUMNS function. Then add the following line:
"Year", YEAR([Date])
//Note: [Date] is the field that was created by default upon creating the _date table
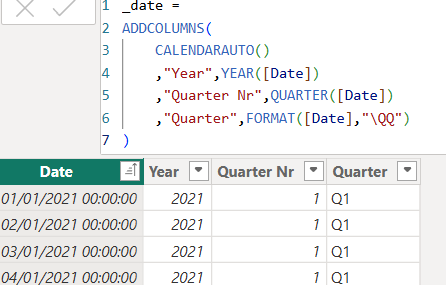
- To create new columns including String fields like Quarters but shown as Q1 you need to use a \QQ or a \Qtr Q wrapped inside a FORMAT function.
"Quarter", FORMAT([Date], "\QQ")
Otherwise if you just want the Quarter as a number you can use the below DAX code:
"Quarter Nr", QUARTER([Date])
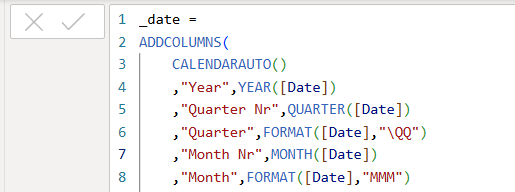
- To create the month abbreviation (e.g., Jan) you will need to add another line to your DAX code like below:
"Month",FORMAT([Date],"MMM")
//If you want to display the month as a full word (e.g., January) then you'd have to replace MMM with MMMM
- To create a continuous date field, so you can use it as a date axis (x-axis) in a visualization chart add the following line to the DAX code:
"Year Month", EOMONTH([Date],0)
//Tip: In the format option change this column specifically to Mmm-yyyy.
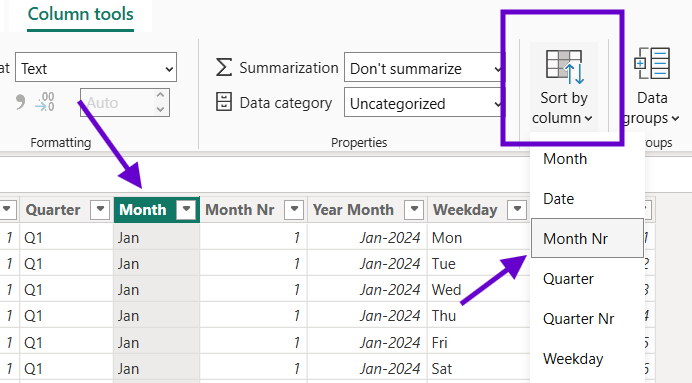
Note: This will not be ordered in a logical way (by default in alphabetical order) when you generate an axis, so you need to order this column by the "Month Nr". The calculation for "Month Nr" is below:
"Month Nr", MONTH([Date])
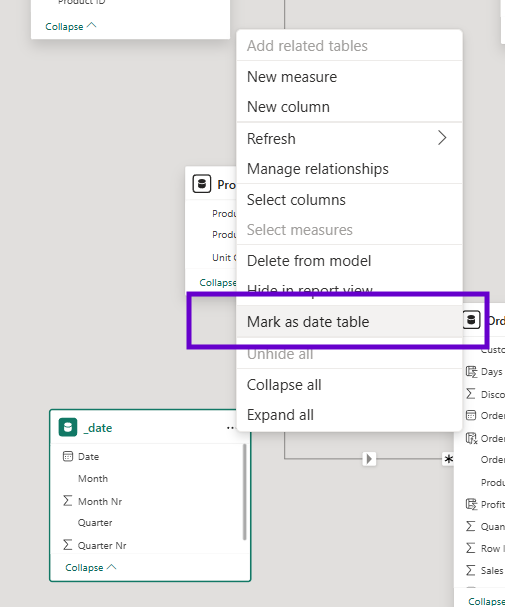
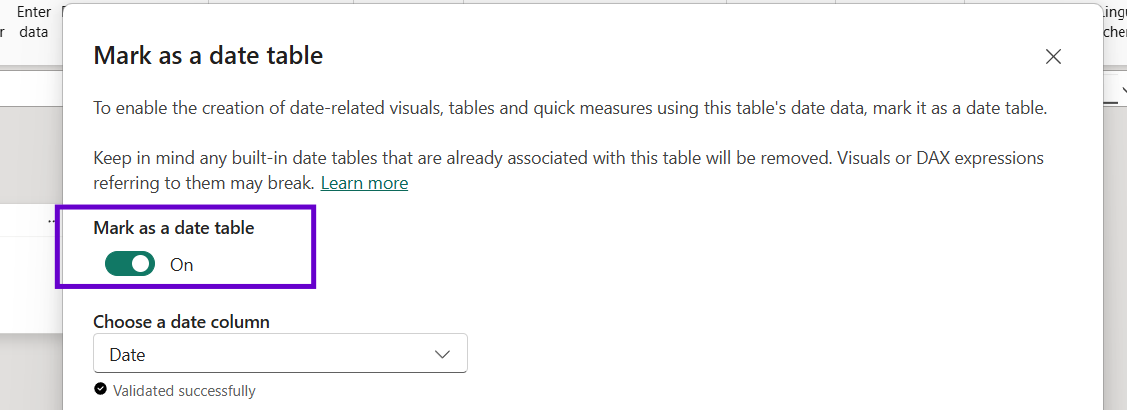
- Ensure you mark this _date table as the date table by right-clicking on it in the Model View > Mark as date table.
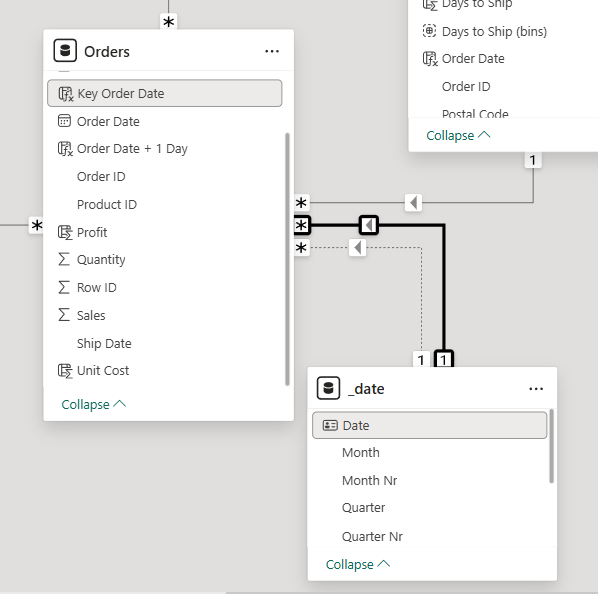
- Now, to connect it to the Orders table all you have to do is create a new column in the Orders table named "Key Order Date", as you don't want to connect them on Order Date:
Key Order Date =
Orders[Order Date]
//Created to prevent previous date hierarchies to break when linking up to the _date table
- Create a 1 to many relationship from the _date table to the Orders table on Date = Key Order Date. You can also create a second relationship on Date = Shipping Date. Note that you will only have one active relationship at a time, so if you wanted to activate the relationship between the Shipping Date and Date you'd need the following calculation.
Total Sales at Ship Date =
CALCULATE([Total Sales], USERELATIONSHIP(_date[Date],Orders[Ship Date]))
Last tip from me is to make sure that the dates in the _date table is cut off where the max date in the Orders table is. This can look like the below DAX calculation where we want to calculate the Total Profit for the same period Last Year. By adding the line _date[Date] <= MAX(Orders[Order Date]) you're defining that the MAX date in your reference date table is cut off to match the MAX date in the Orders table.
Total Profit Same Period LY =
CALCULATE( [Total Profit]
,SAMEPERIODLASTYEAR(_date[Date])
,_date[Date]<=MAX(Orders[Order Date]))
Additional Notes:
_date =
ADDCOLUMNS(
CALENDARAUTO()
,"Year",YEAR([Date])
,"Quarter Nr",QUARTER([Date])
,"Quarter",FORMAT([Date],"\QQ")
,"Month Nr",MONTH([Date])
,"Month",FORMAT([Date],"MMM")
,"Year Month",EOMONTH([Date],0)
,"Weekday Nr",WEEKDAY([Date]-1)
I hope you found this blog helpful, I've made sure to add the full table DAX code for the _date table above so you can easily copy and paste it in PowerBI for your next project!