


I was recently doing an Alteryx challenge which involved generating new rows for a join later in the process. I then tried to complete this same challenge in Tableau Prep and Power Query to test out my skills. I became rather stuck. To be perfectly honest, this was not to do with the level of difficulty of the challenge (i.e. not very difficult) but rather a lack of knowledge on my part. After some deeper thought and googling into generating rows across the different platforms, I was able to complete the challenge thrice over and thought I'd share my findings with you.
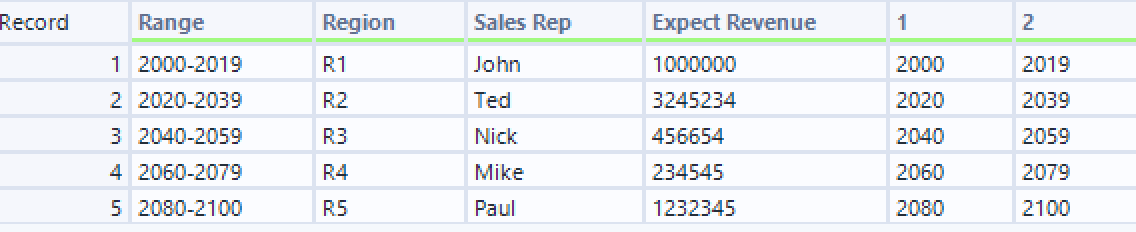
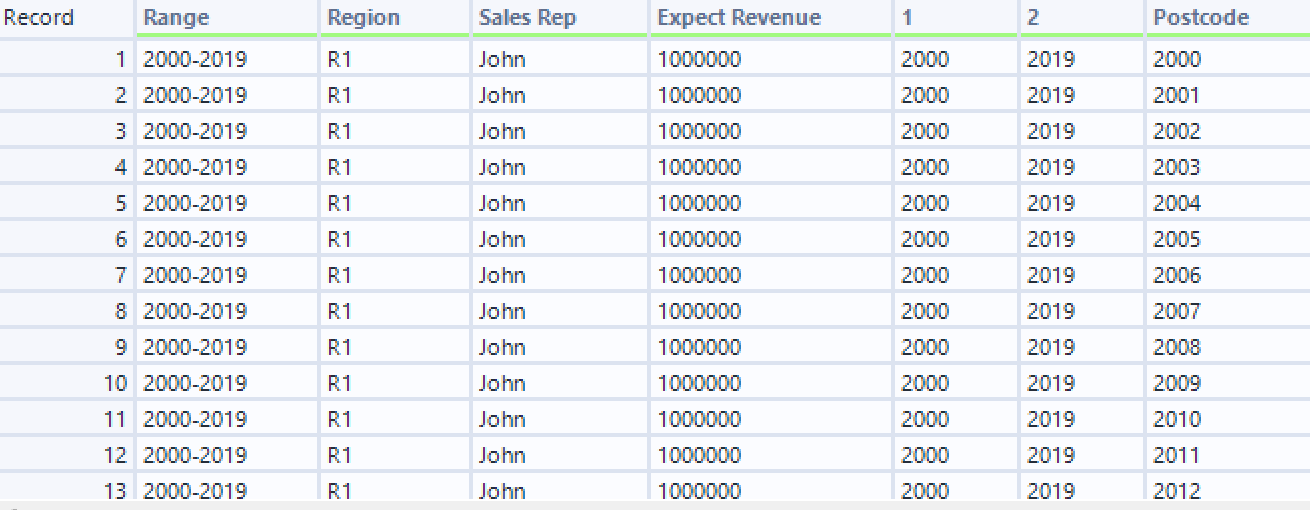
I'll set the scene so that you understand a little more of what I'm talking about. I was given two input files, one with information on a sales rep (the top table), the other on customers (the bottom table). I then needed to determine how many customers there were per sales rep, based on the postcode they were in.
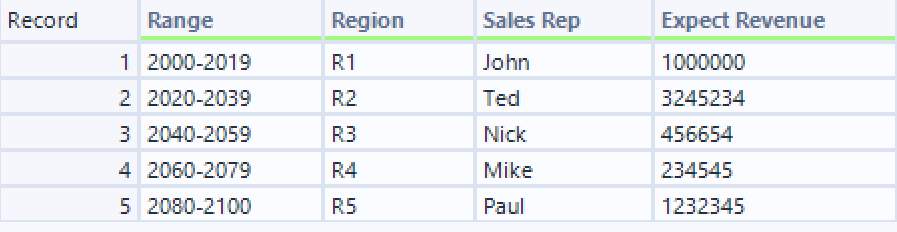
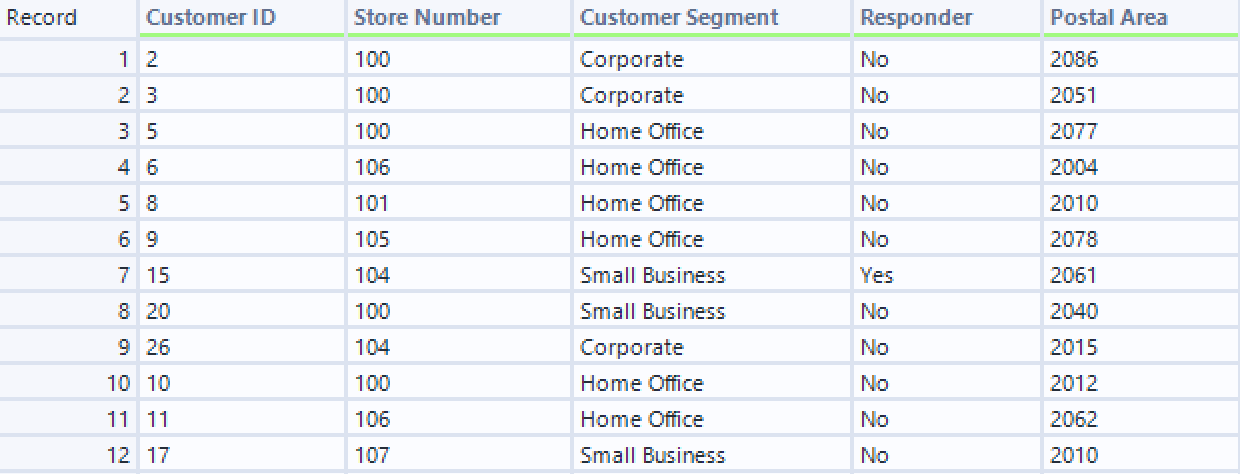
As you can see, the range of postcodes that a sales rep covers is in a different format to the postal area of the customers and, as I needed to join them, I needed to make the formatting the same. Now I think about it, I could have gone about it a different way by changing the customer postal area into the same format as the sales rep range (e.g. adding a fairly long calculation that changed 2086 into 2080-2100 etc.), but this is very manual and if we'd had more sales reps then it could have taken quite a bit of time. For best practice, I needed to generate new rows to create the join. Below you can find how I did it in each software.
Alteryx
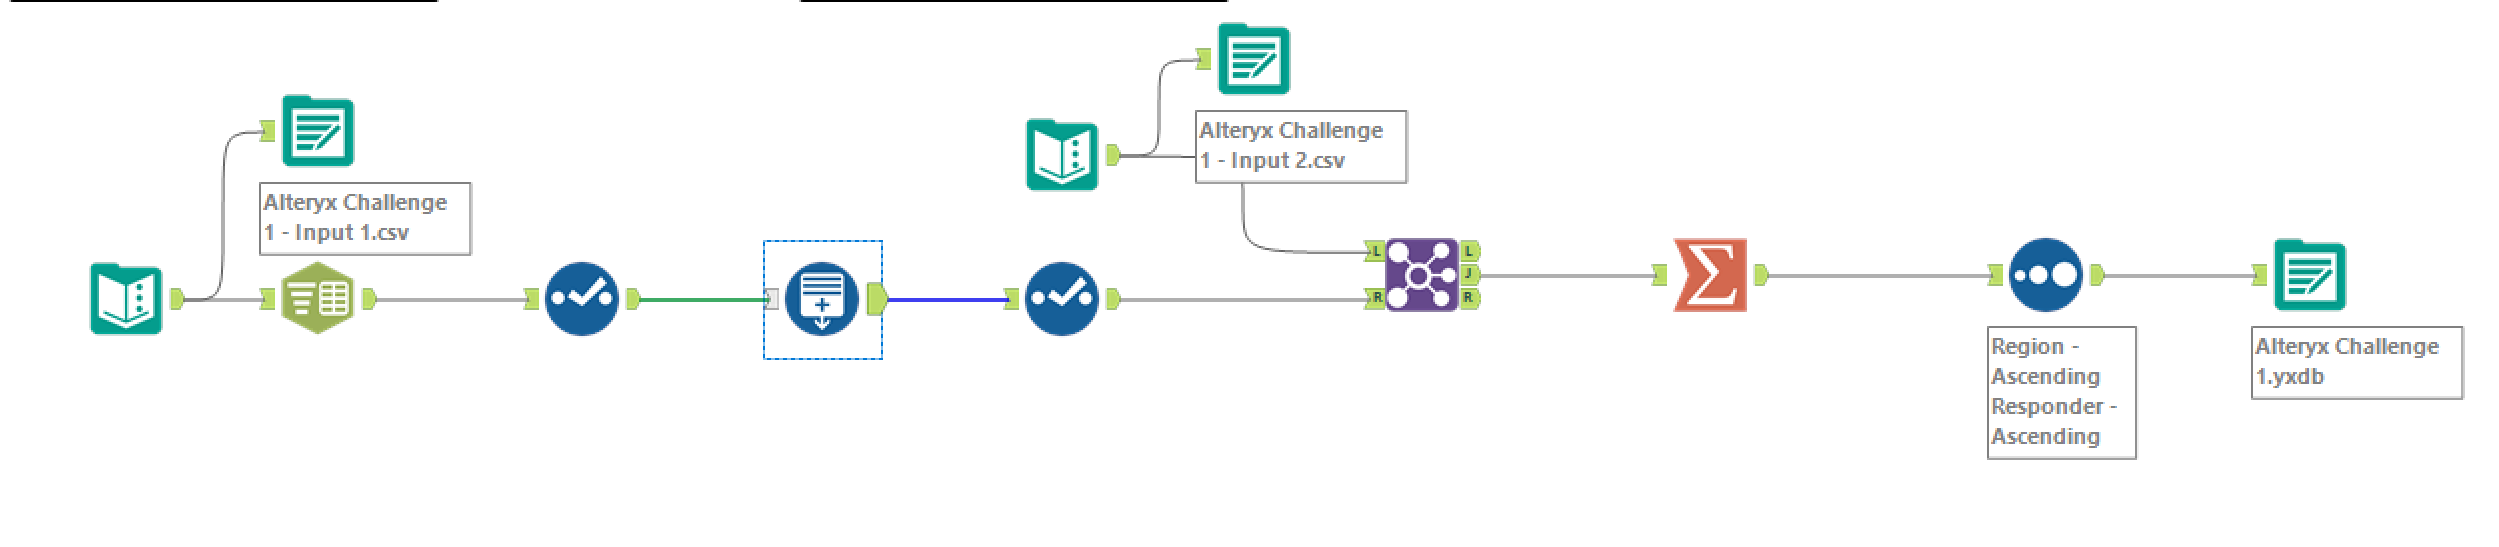
Let's start where it all began in Alteryx. Also, spoiler alert if you're also completing the challenge but I suppose that's probably a little too late and if you're here, you probably need a little assistance anyway.
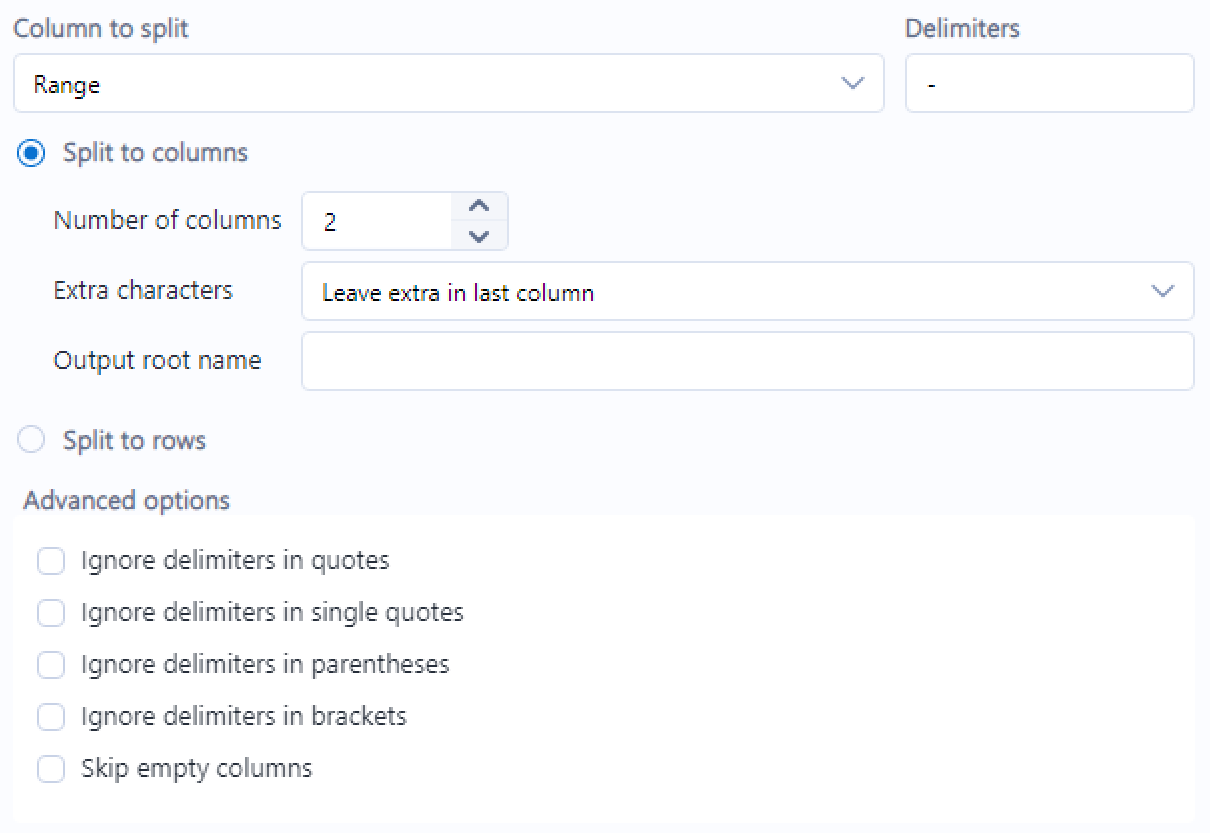
Step 1: Prepare the data. To be able to use the generate rows tool, the data first needed to be in the right format. As you'll have seen in the screenshot of the input file, the data was of course not in the right format. Why would they make a challenge simple when they could make it difficult? In this case, I needed to split the range column into two so that there was one column with the starting value in the range for the sales rep, and one column with the end value in the range for the sales rep. I used a text to columns tool to enable this step. I would recommend using better names for your columns than I did below. Do as I say, not as I do!
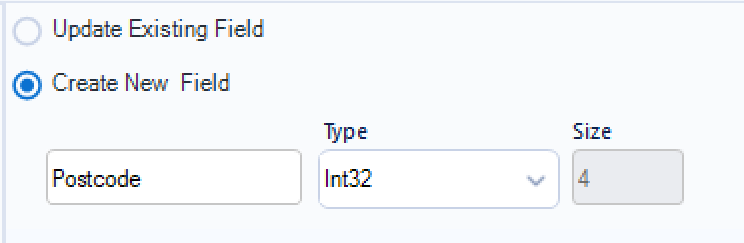
Step 2: Setting up the generate rows tool. Now that your data is formatted correctly, you can generate your new rows. Your tool will be set up with three boxes in the configuration pane. So that I could confirm I had done it correctly, I chose to create a new field called postcode.
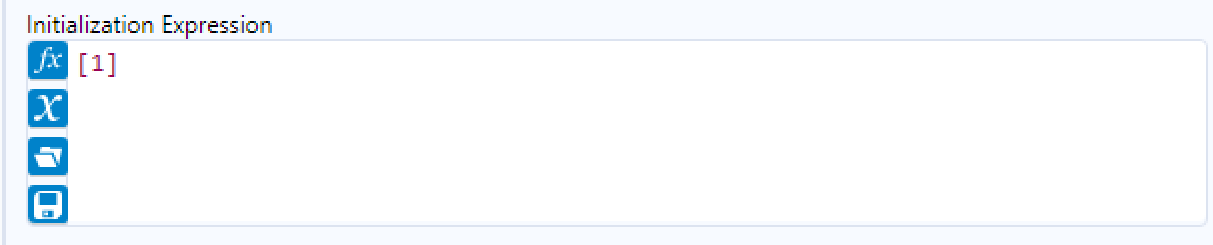
My initialisation expression (and this is where it gets a little complicated based on the column names) is my starting value column. In this instance, it's [1] but you can tell that's a column because it's in the purple brackets. The initialisation expression, as the word implies, indicates where your rows should begin generating.
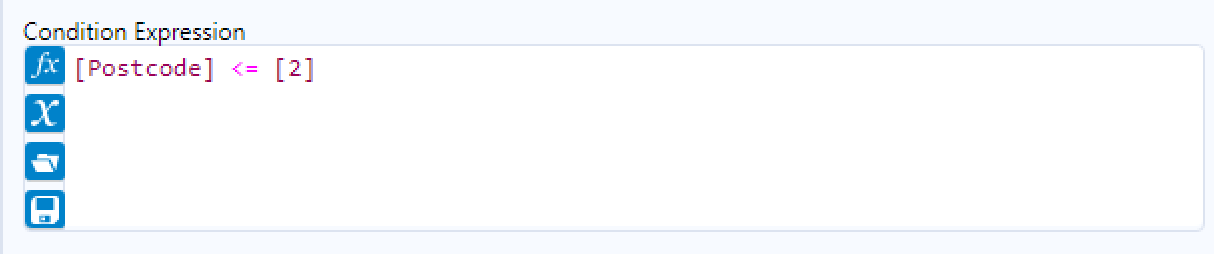
My condition expression is my new column less than or equal to my end value column. In this instance, it's [Postcode] <= [2]. The condition expression indicates where your generate rows tool should run until. Therefore, postcode should be generated until it is equal to the end value column but no more than it.
My loop expression is simply my new column plus the increment that I want to be added. In this instance, it's [Postcode] + 1. The loop expression indicates what the difference between each row should be. In this instance, I want the postcode to increase by 1 each time as there will likely be customers in each postal area. If I knew that the customers were only from even postcodes for example, I might make the increment + 2 to eliminate unnecessary odd rows from being generated.
There you have it. A new row for each postcode, with the same values in all the other columns for that range (e.g. John, R1 for all postcodes generated between 2000 and 2019). Depending on what you're doing with your data, you might want to have null values for the newly generated rows. Whilst there is an option in Tableau Prep for this, as far as I can tell in Alteryx it automatically fills down the rest of the information. You'd have to go about this with a join and it all gets a little more complicated and more case specific which I won't get into today!
Power Query
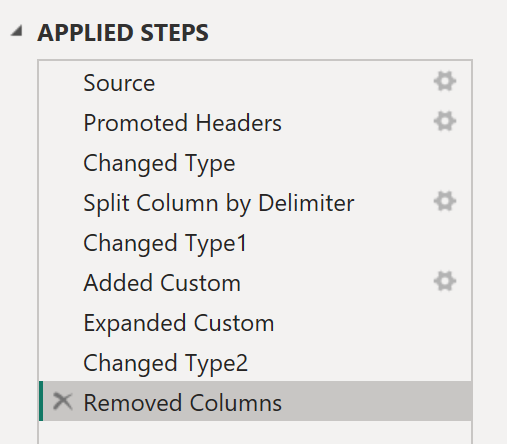
Power Query is the simplest of the bunch that I'm discussing today. Again, please name your steps so that when you come back to this you know what you're doing! Whilst it might not seem important for a short task, it's good to get in the habit and you'll be grateful for it when you do a longer challenge and have no idea what you did to get somewhere.
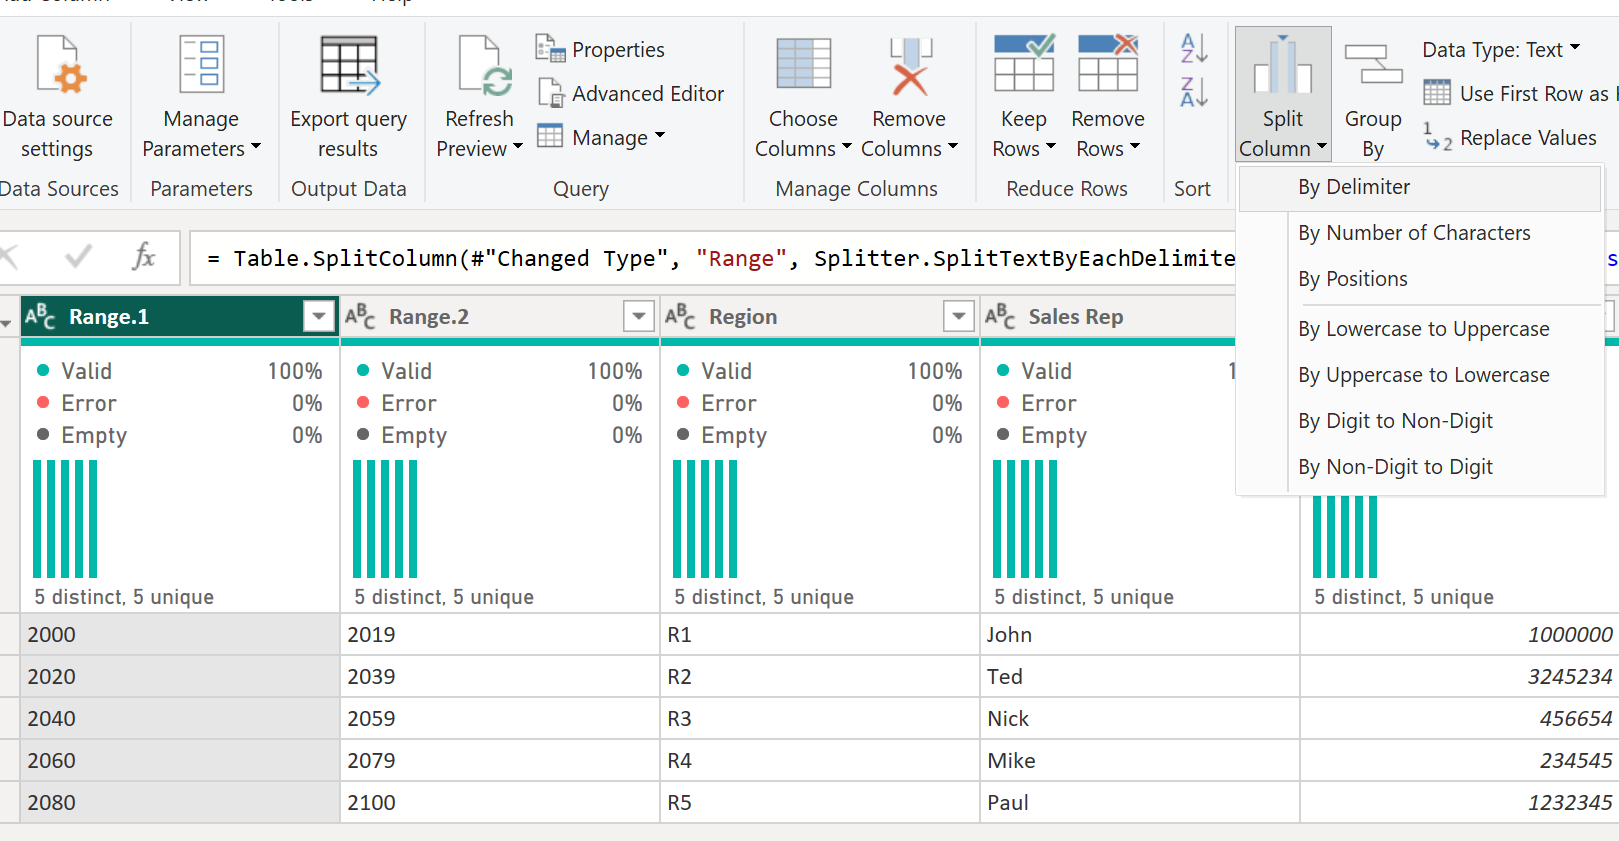
Step 1: Prepare the data. In Power Query, all I had to do was use the split column function, splitting on the delimiter to get my two new columns. I then made sure that my two new columns had the whole number data type to ensure the calculation would work. You can't add numbers to a string!
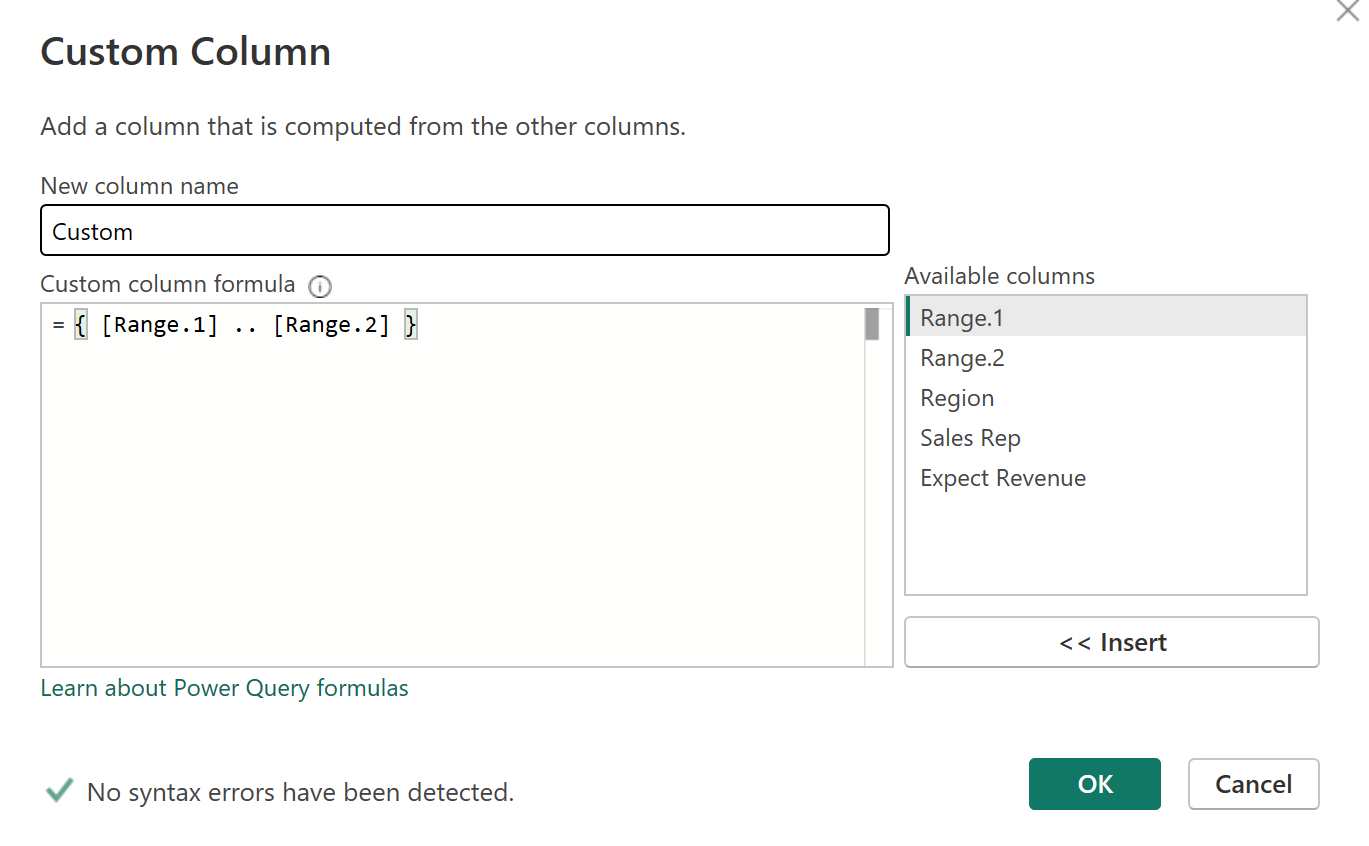
Step 2: Generating the rows. I created a custom column using the formula below. Essentially I had my start column and my end column with two dots in-between which Power Query does magical things with to understand that means fill in the blanks between the range.
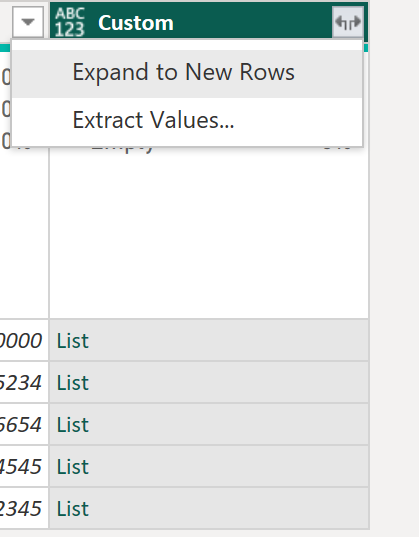
The output will come out as a list. To get this in the format with the many rows, you need to click on the arrows in the top right of the column and select expand to new rows.
And there you have it. Your newly expanded rows. Again, if you don't want them to expand the other columns as well (e.g. write John, R1 over and over and you'd like nulls instead for the new rows), you'll have needed to have done this separately and used a join as far as I am aware. More complicated, too specific, we move on!
Tableau Prep
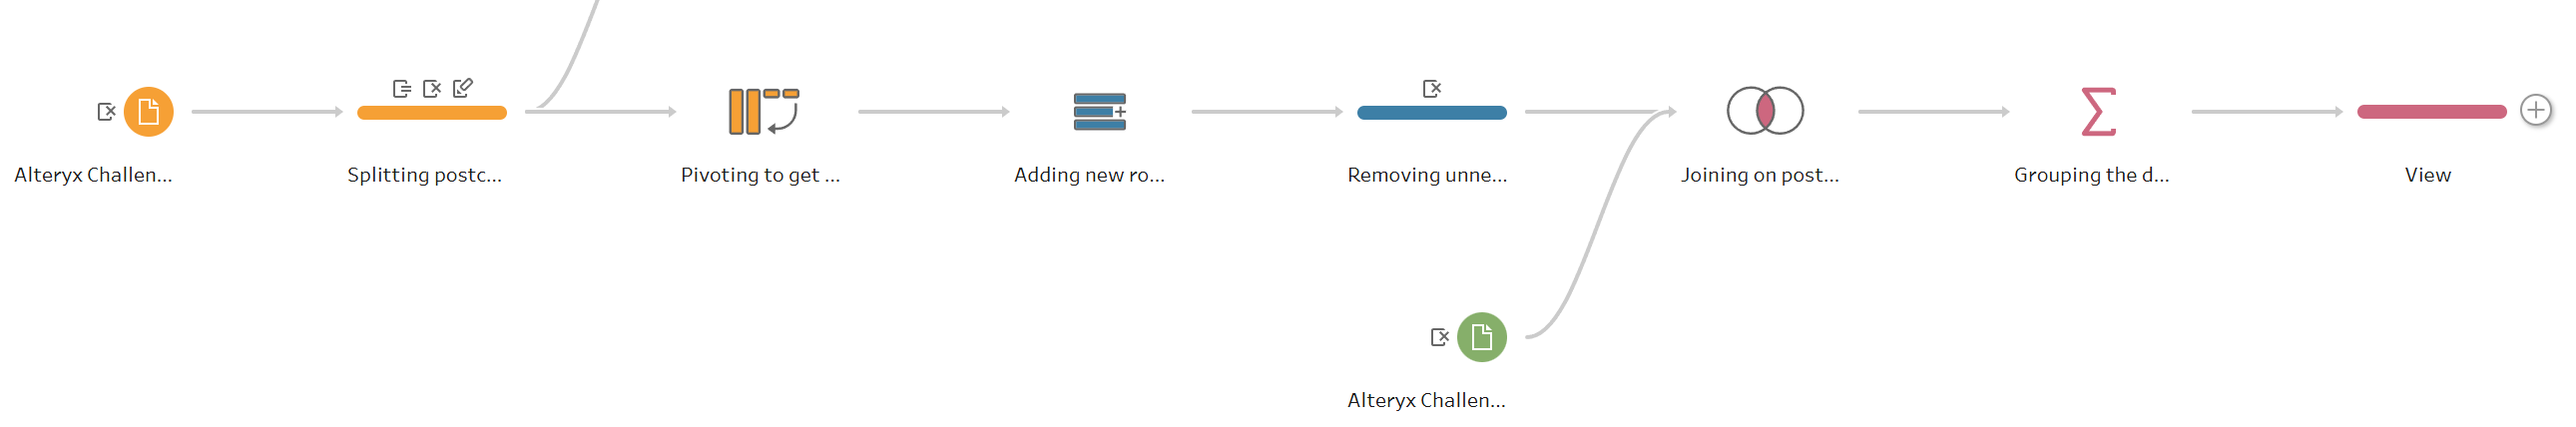
Tableau Prep was the trickiest of them all due to the formatting that was required but now I look at the steps, perhaps I just wasn't thinking out of the box enough to get it right. I also didn't understand a key part that was creating many issues, so I initially did a bit of a bodge job of it all (you can see where the steps branch off in the screenshot!) which worked but exploded rows and then involved filtering. Moral of the story, try not to do that. Instead, understand why something is not going right and how to format the data to get it right.
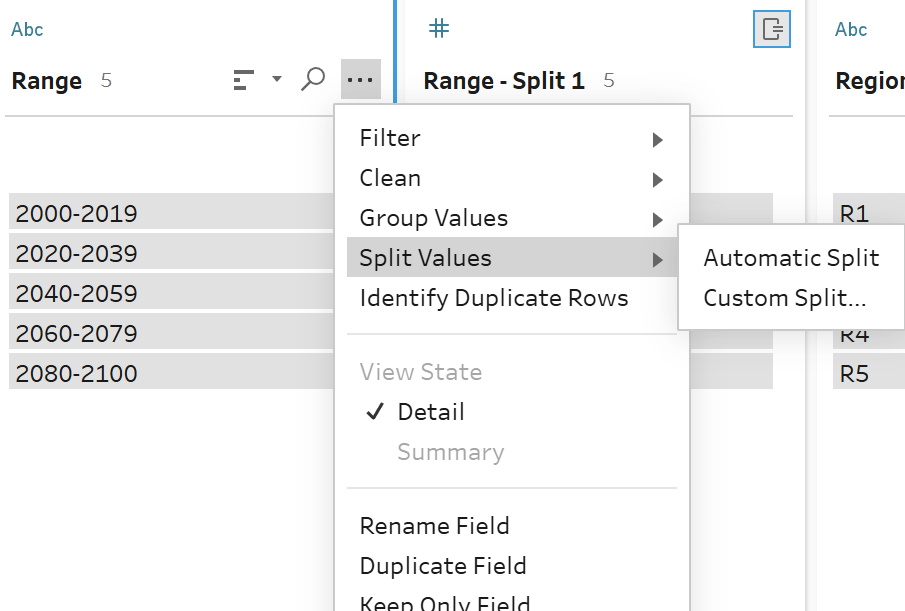
Step 1: Preparing the data. As I'm sure you'll have gathered by now, you have to split the range column. I did an automatic split because it was a simple split, little could go wrong but if there were other bits in the range, I would probably have gone with custom so I could be more specific.
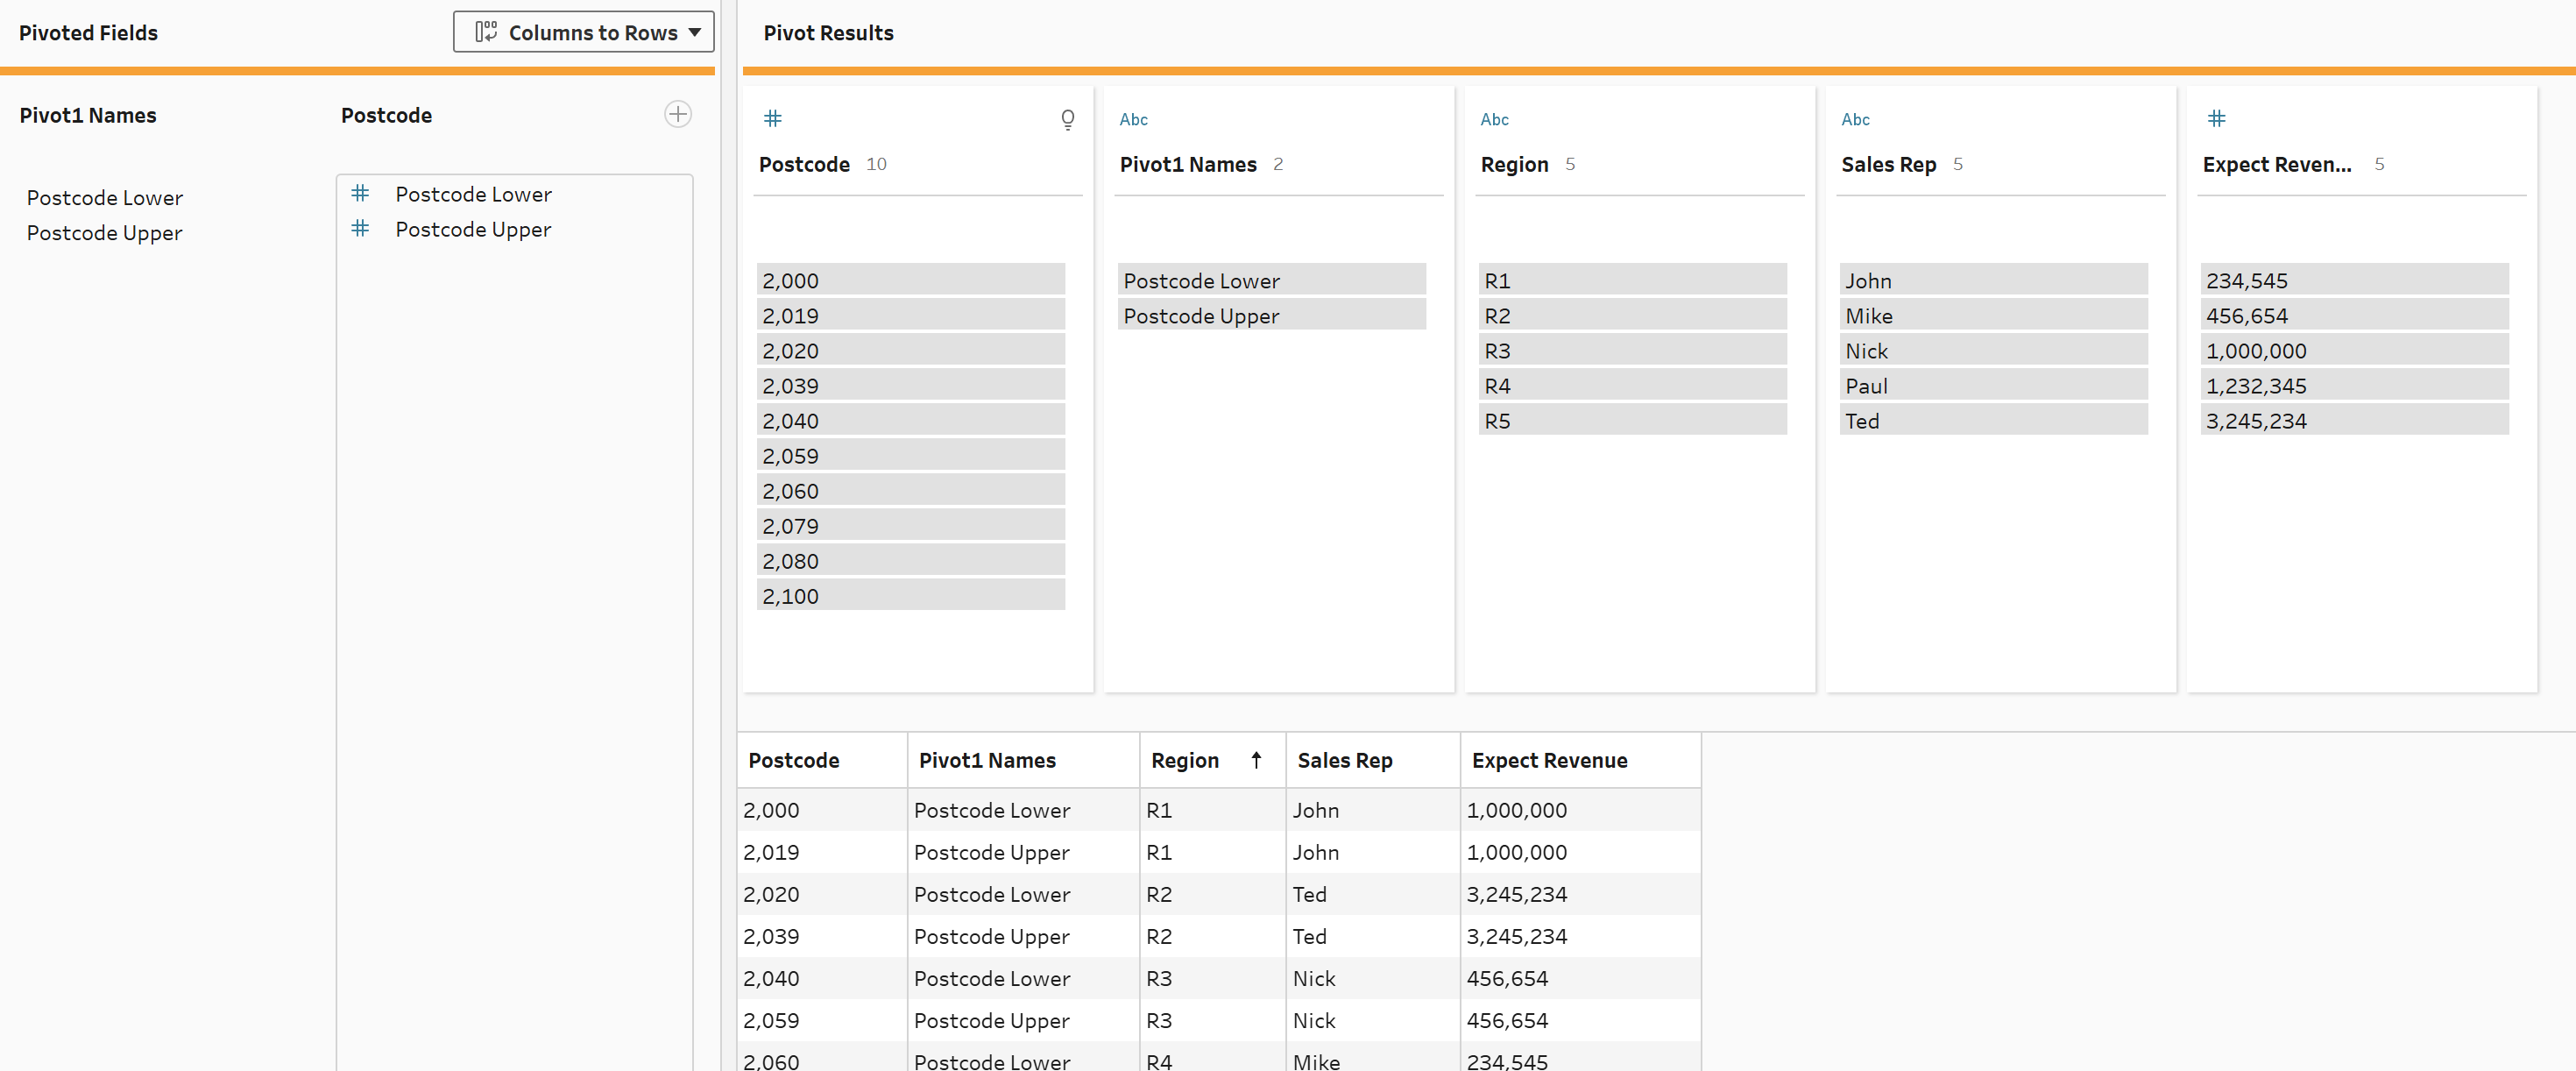
Now, here is the trickier part. Because of the way that the add new rows step is set up in Tableau Prep, I couldn't have my start and end values side by side (I'll go into this more in the add new rows step). They needed to be in one column, and when you want multiple columns to turn into multiple rows, you need to pivot! I'm actually not sure if it's pivoting or unpivoting to be perfectly honest (does anyone know the difference?) but the important part is, you use the pivot step and ensure it's set to columns to rows. Then add your postcode columns to the pivoted fields.
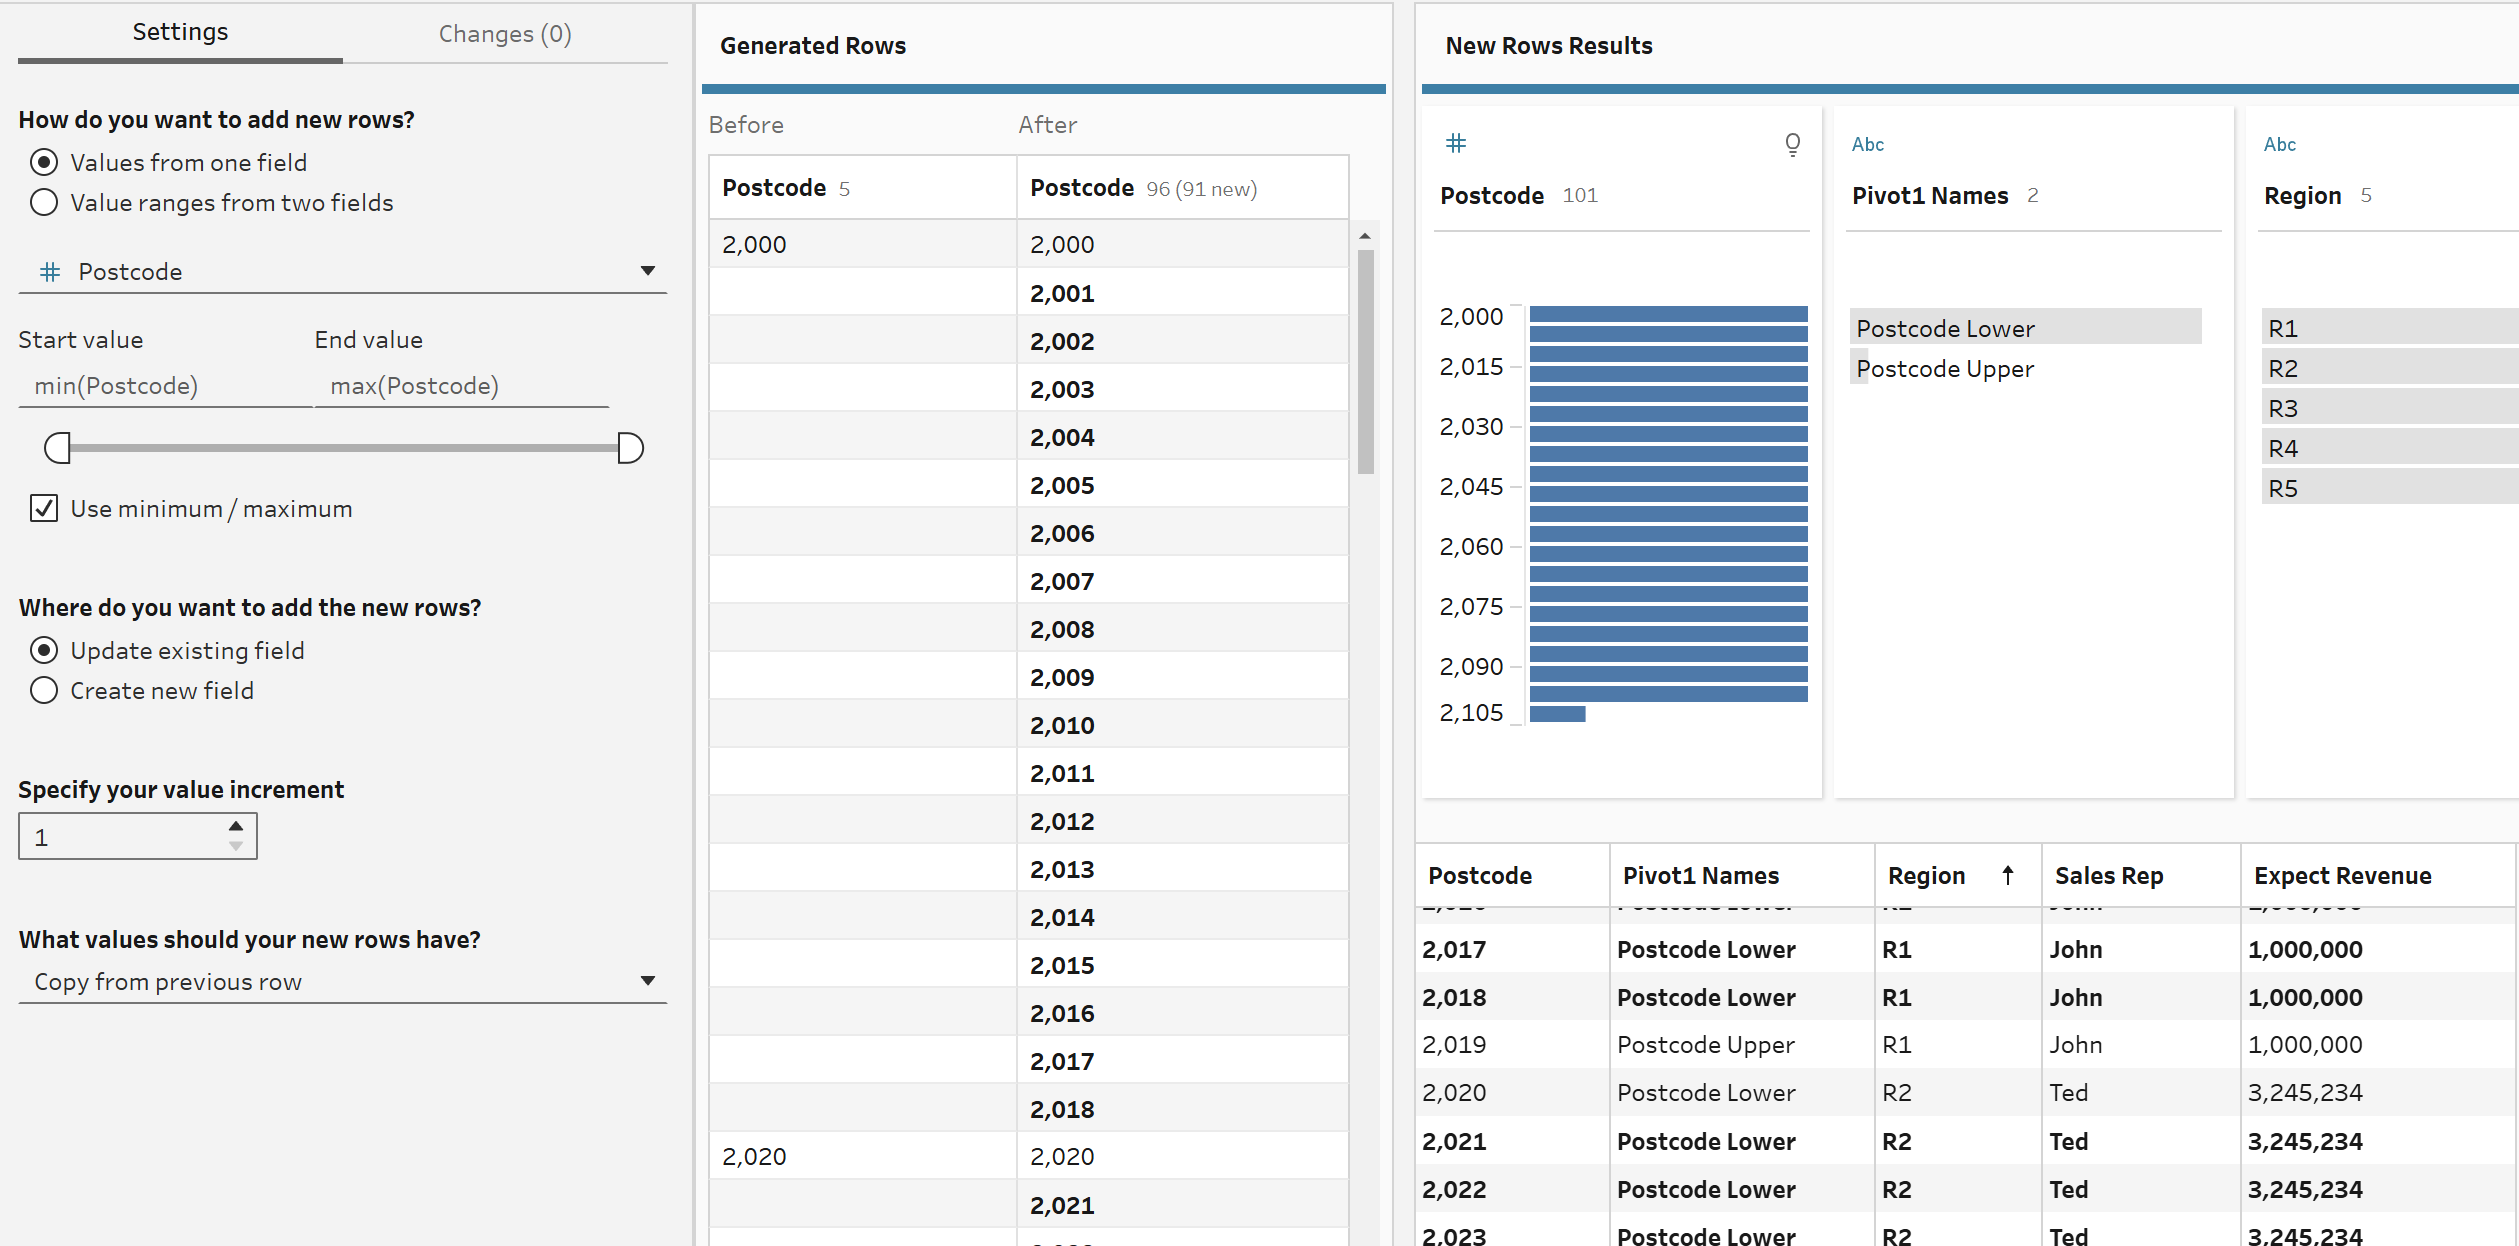
Step 2: Adding new rows. Add the add new rows step to your workflow and then set it up. Now you may have been deceived like I was initially and tried selecting the 'value ranges from two fields' option. I tried doing this for longer than I should have, confounded by the fact that my fields never came up when I typed them in. Well sadly you can only use that option when using dates, which is why we had to pivot to only have one field. Complete the rest of the settings as you wish. Of note, I chose to update my existing postcode field but you could create a new one. Most significantly, unlike on the other platforms, you can choose what values your new rows contain whether that be nulls or the same as the previous row. If you notice that some values are missing in your generated rows section, don't worry. Tableau Prep is a little funky like that and just check that they exist in your new rows results section.
So that's how you generate rows in Alteryx, Power Query and Tableau Prep. Hopefully you've learnt something new and can go away to implement your new skills, maybe even by testing yourself in an Alteryx or Preppin' Data challenge. Give yourself an even bigger challenge by trying the task in all three platforms. Until then, happy prepping!
P.S. I hope someone enjoyed my rows pun in the feature image. Unsplash did not want to provide a data version of add new rows so here we are.