The Time Series tools in Alteryx offer an easy way to predict how a value is likely to behave in the future by looking back at historical values. The function is similar to the Predictive tools. But instead of determining contributing factors, like Tools such as Linear Regression or Decision Tree use, time forecasting predicts future values. Especially when there is much seasonality or noise found in the data, using time forecasting works far better than linear regression, which might be the first idea.
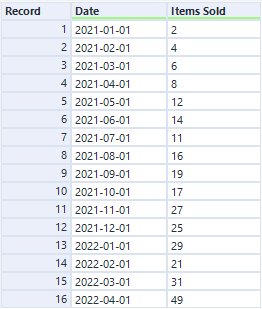
If you have data such as in Fig.1, and want to determine the items you will most likely sell in May and June of 2022, it is a good idea to use the Time Series (TS) tools.

The idea of the TS tools is to compare values within one column to the previous ones, this is called “Autocorrelation”. The value of 2022-04-01 is therefore put in context to the values of the previous months, and these correlations are used to make the prediction.
There are two different TS forecasting tools, ETS (Error Trend Seasonality) and ARIMA (Auto-Regressive Integrated Moving Average). The tools use a different algorithm, but the underlying idea is the same. Depending on the data one might work better than the other, but the differences should be neglectable in most cases.
There is not much configuration needed to use these tools. You just have to make sure that you select the correct Target Field Frequency, as this needs to match the data. In the case of Fig.1, this means “Monthly”. The two tools both have three output anchors, two for reports (interactive and static) and one for the model itself.
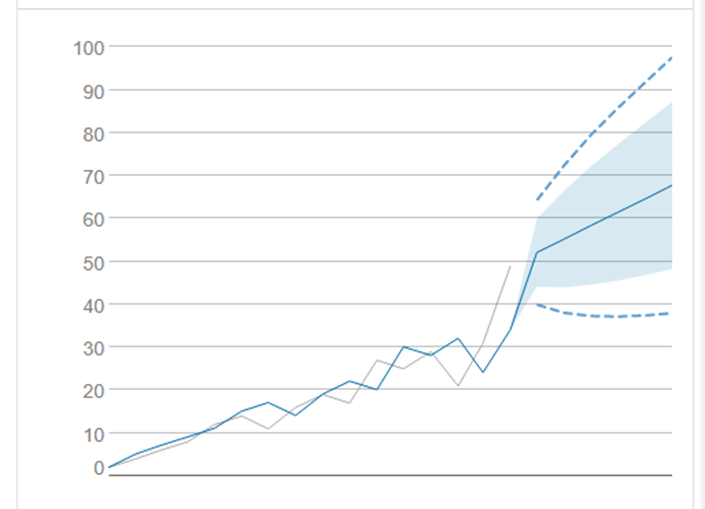
The interactive output for an ARIMA tool is shown in Fig.2.

Using the “O” Anchor, the model is accessible to use further in the workflow. You can connect this output to a TS Forecast tool. Here you can select how many future time periods you want to guess, and also choose the confidence interval you want to see.
This tool also has to report outputs, but also one text output “O” where you then get the values for the chosen time periods. The output is shown in Fig.3.

Here can see the prediction of the sold items for May and June to be 52 and 55, but the confidence interval is pretty big for both months.
