


Last week, I was tasked with creating a Tableau dashboard on pay inequality in the UK. One of the key questions I was trying to answer was how the gender pay gap differed across different industries.
Theoretically, this was straightforward. I had a raw fact table containing information on the gender pay gap within UK companies for one year. This table included the company name, the gender pay gap for that company (a measure), and a field for the SIC code for each table: a legal classification of a company's main business activity. A list of SIC codes and their definitions is publicly available in table form. So theoretically, all I'd need to do is join or relate these two tables based on their SIC code, like so:
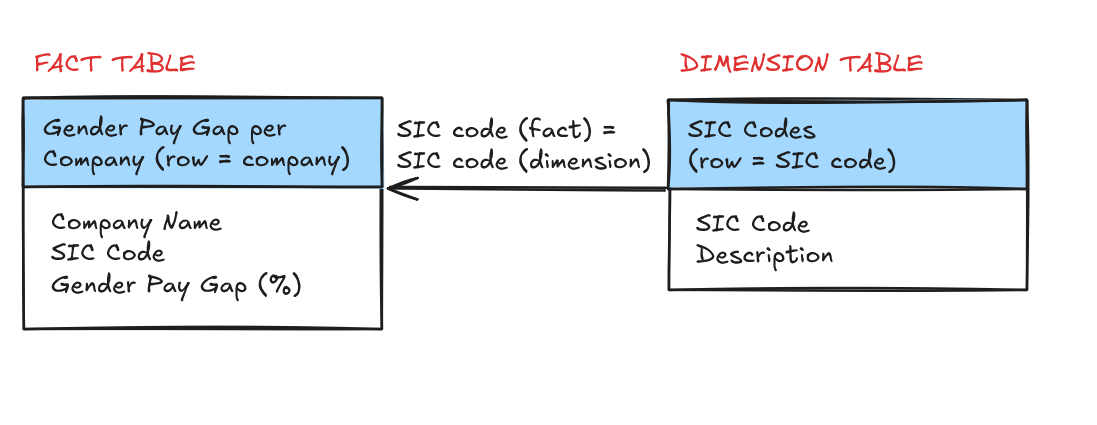
Simple, right?
Plot twist: it's not actually that simple
While on the surface this is straightforward, their was one problem: Companies can be registered under multiple SIC Codes (in this table, they are a comma separated list within the field). Since you need the fields to match exactly for either a join or a relationship, this makes specifying a join condition much more complex.
The immediate (and not great) options that came to mind were as follows:
- Arbitrarily select one of the SIC codes to use for the join. While this would make the join quite simple, this is obviously not a great idea. Using this method, I'd be losing a significant amount of potential data. Arbitrarily picking which data to include is never ideal!
- Pivot the data so that you have one SIC code per row and company. This way I'm not losing any data, but I'm also affecting the row-level of my data such that one row no longer equals one company. I'd be artificially duplicating my measure, which means any aggregates inaccurate without prior filtering/fixing.
Ideally, I want to keep the row-level of my table at one measure per company. But I also want any filters on SIC Code to filter to all companies within that SIC Code, even if multiple SIC Codes are listed for some of those companies. For that purpose, both of these options are out. But what can I do instead?
The solution
Making my data model slightly more complex allows me to keep the row level of my fact table consistent without excluding any data. Rather than trying to link my fact table (row = Company Name) with my SIC code dimension table (row = SIC Code) directly, I can create an intermediary table. In this intermediary table, the row-level is the Company Name AND the SIC Code. I can relate my fact table to this intermediary table using the Company Name, and then relate my dimension table to it using the SIC Code.
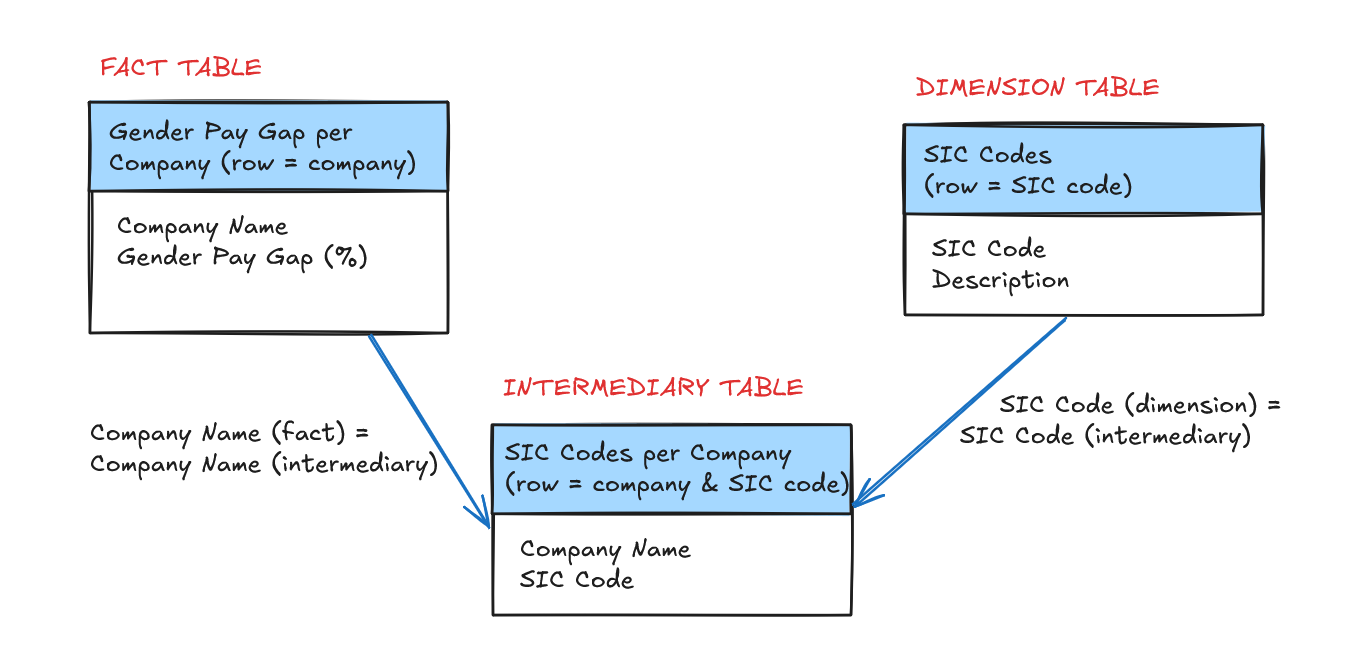
As a result, my fact table can talk to my dimension table, but I haven't actually lost any key information and I've kept the row level of my fact table where I want it to be. Perfect! If you're ever in a similar situation with your data, don't compromise: think more carefully about your data model, and you may be able to come up with an ideal solution.