


As a trainee at The Data School, we’re constantly learning by doing — jumping into real-world data problems, even when they’re messy, unfamiliar, or just plain weird. As a personal project, I decided to revisit something I’d struggled with in the past: turning a BibTeX file into a clean table.
What is a BibTeX File?
BibTeX is a reference management format used primarily in LaTeX documents to organize bibliographic information. A single BibTeX file can contain dozens (or hundreds) of entries, each following a specific structure like @article{...} or @book{...}. One entry can be split over many lines and provides information about a given reference using multiple keywords. While this format is great for academic papers, it’s not exactly analysis-friendly in its raw state.
Initial Setup
Since Alteryx does not have a direct connector to .bib files (the native format for BibTeX entries), the first step will be to save the file as a .txt file and drop it into our workflow. I configured it as a delimited text file, with the delimiter set to ‘None’. Make sure ‘First Row Contains Field Names’ is unchecked!
Building the Workflow
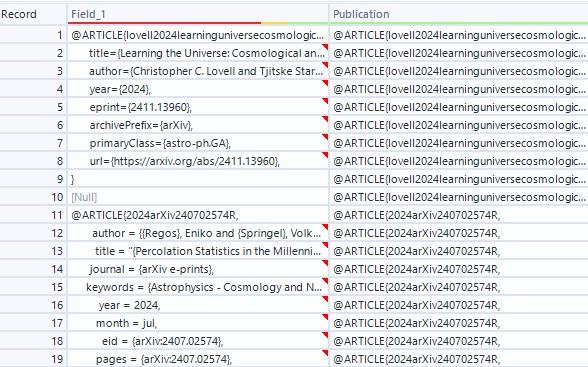
Each row of our final table must correspond to an individual publication. When first ingested, each publication is split over many rows. To group these, we need to create a new field to indicate which publication each row belongs to. To do this, I use a multi-row formula tool. This new field is populated with the following logic:
> If the current row begins with an ‘@‘ (meaning a new publication is being defined), our new field should contain the contents of that row.
> If the current row begins with anything else, it must be a part of the same publication as the last row. This means our new field should contain the same contents as the previous row.
The output should mirror the following table:
Next, we split our data using a Text to Columns tool. Each column of our final table must correspond to a characteristic of the publications (e.g., year, authors, pages, etc.). To accomplish this, we have to search for all rows which have a data assignment. This can be done by splitting our table into two columns, delimited by an equal sign. If we have
> year={2024}
We would like to split this into two columns; one for the characteristic or keyword, and one for the value.
> year
> {2024}
After applying a filter to remove any rows with nulls (rows that did not contain a data assignment), as well as cleaning unnecessary whitespace and brackets, we are left with the following table:
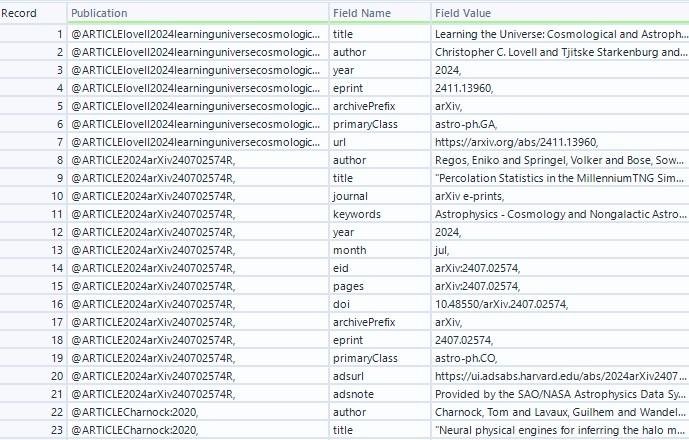
This looks much better but we’re not quite done. The last step is to transform the data using a cross-tab tool. Again, we want each row to represent a publication. This means we should group all rows which are linked to the same publication. Our column headers and values should be the pair of fields we created using the Text to Columns tool. A successful cross tab will output data with the following format:
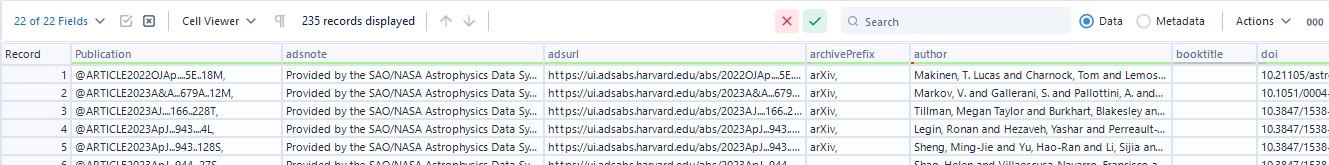
At this point, our data is structured exactly how we want it: one row per publication, with each characteristic (author, year, title, etc.) in its own column. From here, the dataset is ready for any kind of downstream analysis or transformation — whether that’s filtering by publication year, visualizing trends, or exporting to another format. The messy BibTeX has officially been tamed!
This is what my final workflow looks like:
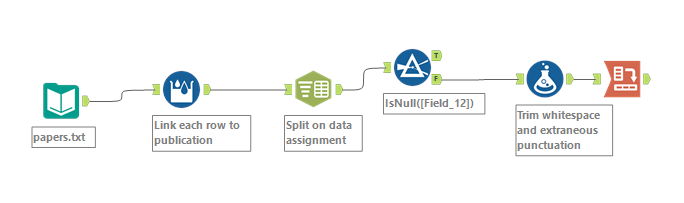
While this workflow successfully parses BibTeX into a tabular format, there’s plenty of room for improvement. One major challenge is the flexible, user-defined nature of BibTeX fields — different entries can contain entirely different sets of fields, which means a wide cross-tab can easily result in hundreds of mostly-empty columns. To improve this, I could implement logic to prioritize or limit the output to only the most common or relevant fields, or flag uncommon fields for review. Finally, creating a macro could turn this workflow into a reusable tool for others working with academic references. I plan to revisit this project further into my training at the Data School, so stay tuned for a part 2!