


Current Year Profit:
This Tableau calculation is a conditional statement which evaluates whether the year of [Date Selector] matches the year of [Order Date]. If they are the same, it returns [Profit] for the selected time period. The [Date Selector],in this instance, was a parameter designed to show profits for only that particular year.
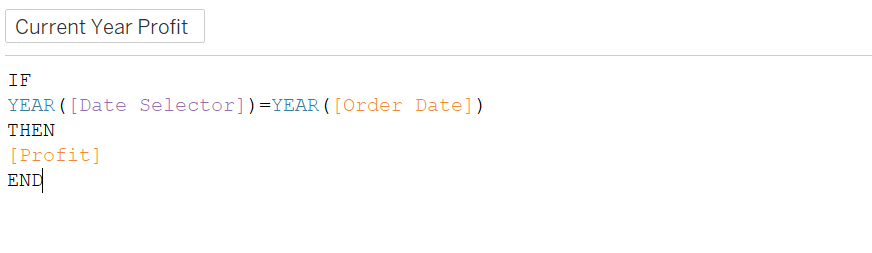
- YEAR([Date Selector]) → Extracts the year from the [Date Selector] field.
- YEAR([Order Date]) → Extracts the year from the [Order Date] field.
- IF YEAR([Date Selector]) = YEAR([Order Date]) THEN [Profit] END
- If both extracted years are the same, it returns the value in the [Profit] field.
Past Year Profit
This Tableau calculation checks whether the year of [Order Date] is exactly one year before the year of [Date Selector].The function is almost identical to the one above, apart from YEAR([Date Selector])-1, which is there in order to return the profit for the previous year. As the [Date Selector] is a parameter, this dynamically filters data to show profits for the previous year.
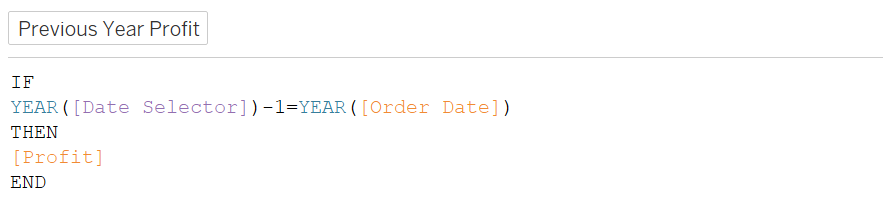
- YEAR([Date Selector])-1: → Extracts the year from Date Selector and subtracts This gives the previous year.
- YEAR([Order Date]): →Extracts the year from the Order Date.
- Comparison: → If the Order Date falls in the previous year (compared to the Date Selector), the condition is True.
- THEN [Profit]: → If True, returns the Profit for that order.
Use Cases
If you use both calculations together, you can compare current year profit vs. previous year profit in a couple of different ways.
- Year over Year Profit Growth
A useful method for comparing metrics such as revenue, profit, sales, etc. between the same period in two different years. It can help businesses understand growth trends and annual performance without short-term and seasonal fluctuations affecting the results. The formula for YoY growth is
(Current period value - Previous period value) / Previous period value x 100
- KPI Current Year vs Past Year Comparisons
Key Performance Indicators allows users to interpret larger data trends in clear and easy to interpret numerical format. You can also add conditional formatting (Green for growth, Red for decline) to make the KPI more visually impactful.