


For Day 2 of DS49’s Dashboard Week, our challenge was to work with UK Street Crime data between March 2024 and March 2025. Using data sourced from the UK Police Data Portal, we were tasked with designing an interactive Alteryx app that would allow users to filter crime data based on date range, crime category, and specific area or postcode.
Creating the App
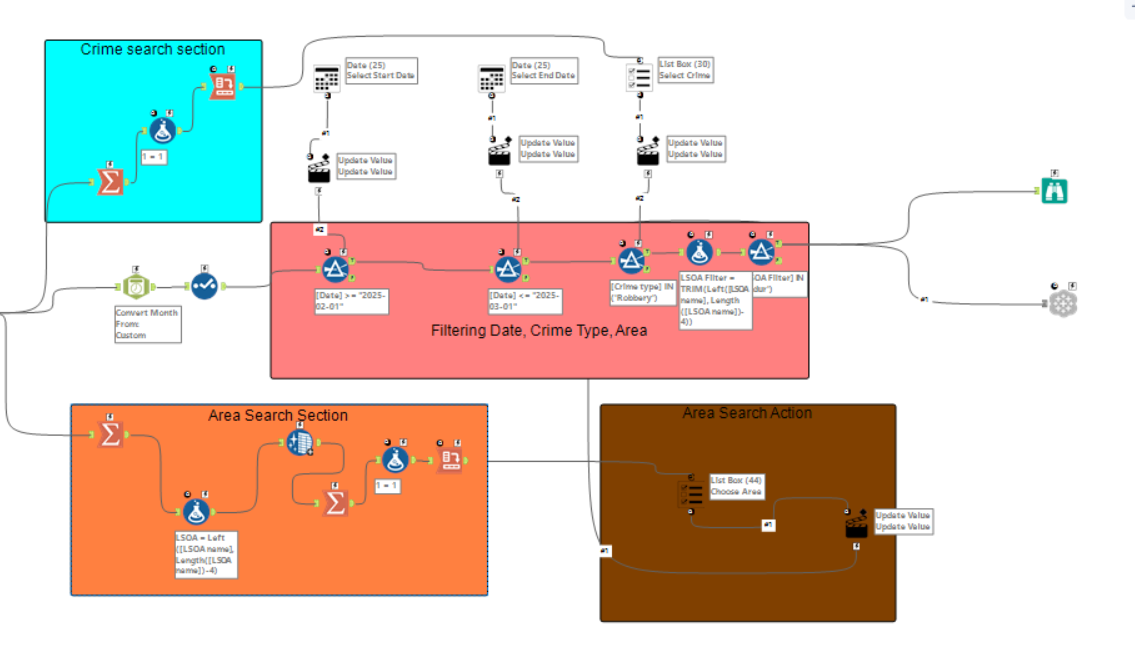
The Crime Search Section (Blue) and Area Search Section (Orange) work together to prepare the dataset for user-driven filtering within the Alteryx app. The Crime Search Section summarises the available crime categories from the data and presents them through an interactive List Box tool, allowing users to select one or multiple crime types for analysis. I also used the summarise tool to create a crime type list remains clean and accurate. Together, these sections set up the dynamic inputs needed for the user to customise their analysis by both crime type and location.
Two Date Interface tools allow the user to select a start and end date, defining the analysis period. A set of Filter tools then applies these user-defined parameters to the dataset, retaining only the records that fall within the specified date range.
The Dashboard
The objective was to develop a KPI-focused dashboard that was clear, insightful, and visually appealing. To enhance the geographic analysis aspect, I made use of some of Tableau’s spatial capabilities, including the buffer tool, which added depth to the location-based insights.
The main features of the dashboard included:
- Total Crime Count — giving a high-level overview of the number of reported incidents.
- Monthly Trends — illustrating how crime patterns shifted over time.
- Crime Type Breakdown — offering a detailed summary of crimes by category for a more granular perspective.
I kept the layout simple and clean to ensure the data was easy to interpret while making the most of Tableau’s advanced visualisation options. Although time limitations meant I was only able to complete the analysis for a single crime type, I plan to revisit the project later this week to incorporate additional categories and refine the final output.
In summary, Day 2 of Dashboard Week focused on building an interactive Alteryx app to filter UK Street Crime data by date, crime type, and area, feeding into a KPI-driven Tableau dashboard. The workflow combined dynamic user inputs with spatial tools to enhance geographic insights, while the dashboard featured clear, focused visuals highlighting total crimes, monthly trends, and crime type breakdowns. Although limited time meant only one crime type was fully explored, the foundation is in place to expand the analysis further in the coming days.