


Today's challenge centered around the computer game Path of Exile...haven't got a clue what that is ? We'll neither did i ...
After an hour or so of research I managed to find out that Path of Exile (PoE) is of the most unique player-driven economies in gaming. Instead of gold, PoE runs on a barter system using various currencies and rare items. Each league represents a fresh economy, where no items or currency exist until players begin finding and trading them. Value perception rapidly evolves, driven by utility, rarity, hype, and speculation. As a result, I formulated my dashboard around the question: Which Items Are the Most Volatile in Price?
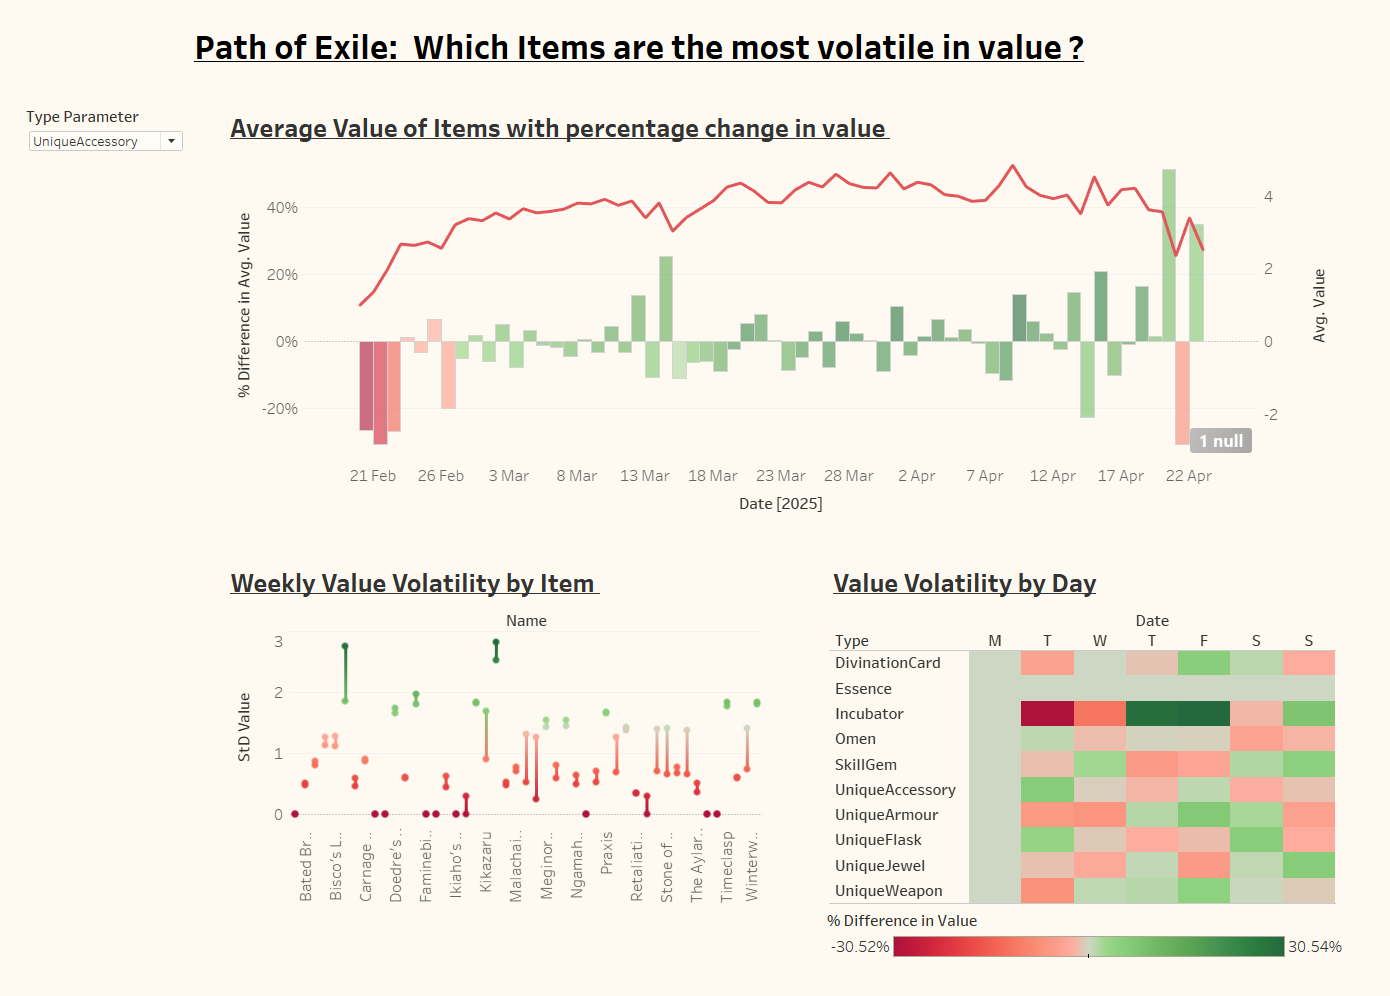
I designed a dashboard exploring a slice of this dynamic economy using publicly available trade data dumps from poe.ninja. I focused on two key datasets: items.csv and currency.csv, which record item values and currency exchange rates throughout the lifespan of different leagues.
When I first began working with the item and currency trade data, I quickly realised this wasn’t going to be a straightforward analysis. The dataset was dense, filled with interconnected fields, and the relationships between them weren’t immediately obvious. It took time to not only familiarise myself with the structure of the data but also to unpack how each field influenced others. However, after this I was able to begin planning my dashboard
The dashboard was built around three main objectives:
1. Value Trends Over Time
While a candlestick chart was initially planned to capture daily price ranges (high, low, and average), the available data lacked the granularity needed for accurate high and low values per day. Instead, I utilised a dual-axis line and bar chart. The line chart tracks the average value of items over time, while bars display the percentage change from the previous day’s average value. This approach still highlights volatility effectively, revealing sharp rises, steady climbs, or sudden dips in item prices across the league’s timeline..
2. Volatility Metrics
A dumbbell chart compares the standard deviation of item prices across the league. By highlighting items with the widest value ranges, it reveals which commodities experience the most price uncertainty — crucial for both investors and opportunistic traders.
3. Market Hype Detection
Finally, a heatmap scatter plot maps items by value changes and trade frequency, uncovering niche or hyped items that might be undervalued or poised for a spike. This was aggregated to a day of the week level or weekly summaries.
In the end I came up with the dashboard below. While it wasn't exactly what I had in mind at the start due to the lack of data for demand, I'm content enough with it considering I put it together in around two hours.
Conclusion
While initially challenging due to the dataset’s complexity, this project successfully translated PoE’s dynamic economy into clear, actionable visuals. It could have been much improved had the transaction data not been pre-aggregated, but then again we had no control over that.