Challenge: Today's challenge was to build a dashboard from data sets about a video game called Path of Exile. I have never heard of this game before and don't play video games so this was new territory for myself.
My approach: Data prep was fairly simple; I downloaded the relevant files and used a wildcard in the input step in Alteryx to pull through all the files I needed. Then I extracted as a hyper file (as a csv the file kept crashing Tableau).
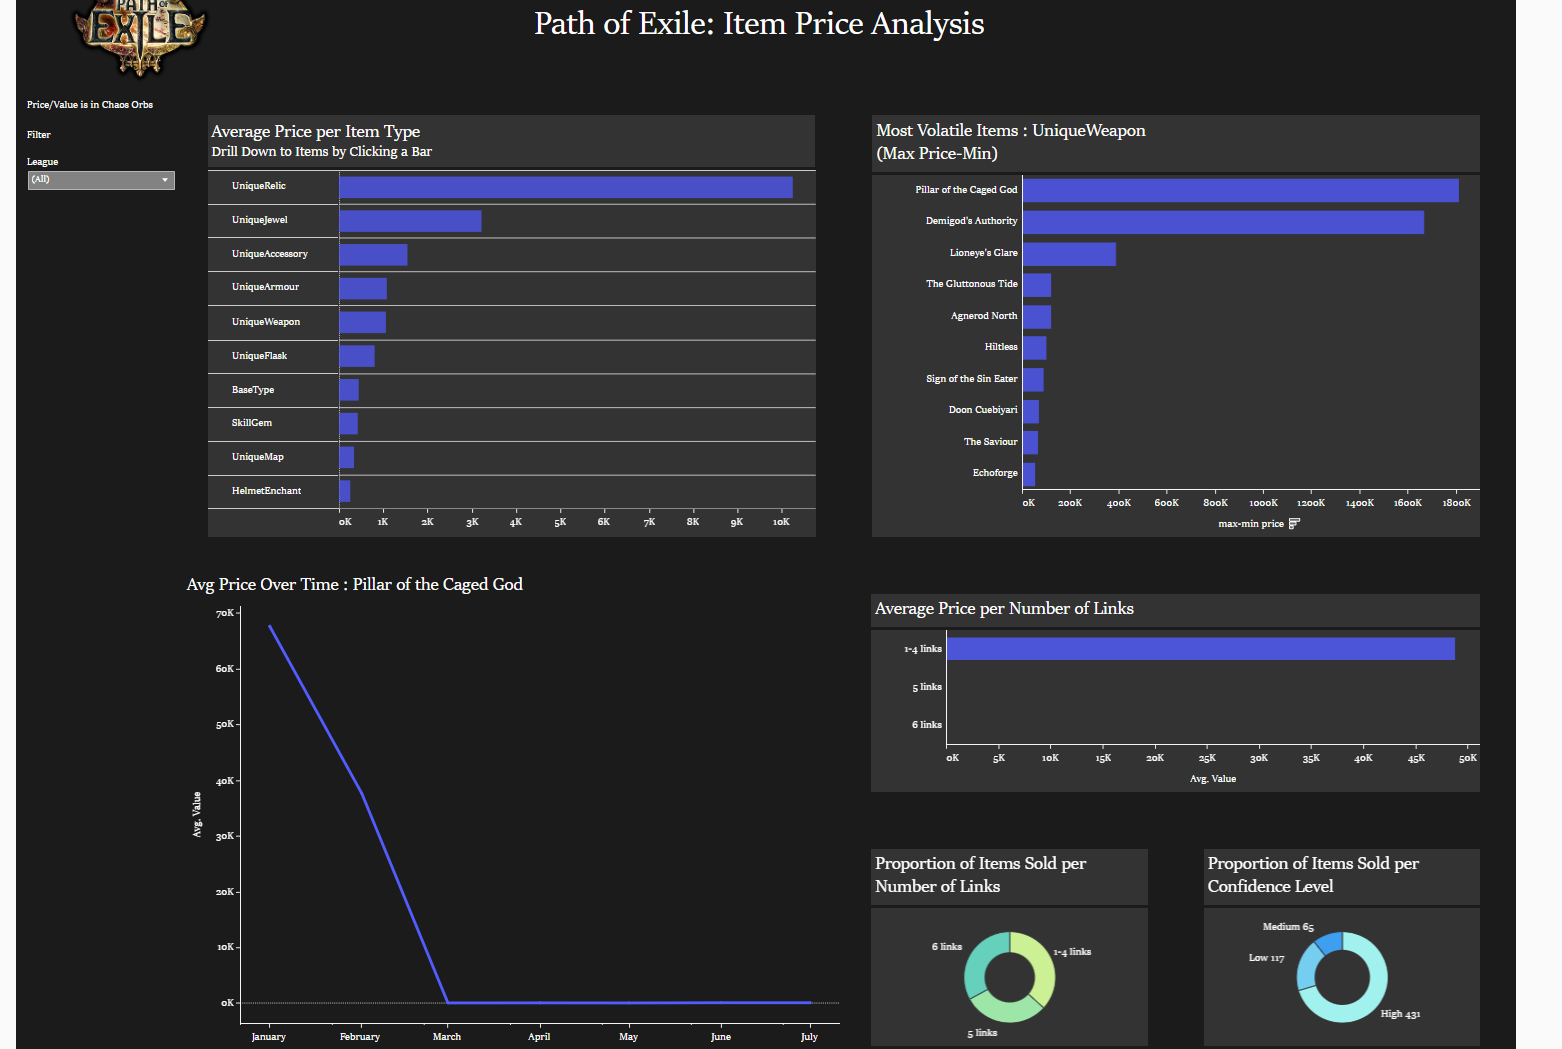
My analysis focused on investigating how items are priced in the Path of Exile. In this dataset, item value was Chaos Orbs (a value of 1 meant that you need 1 Chaos Orb to purchase).
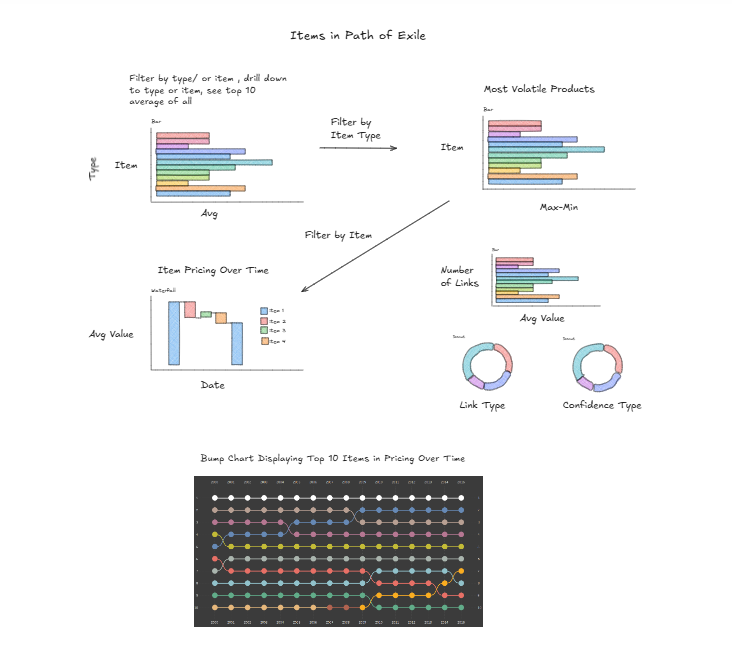
Here is my sketch:
One key lesson from this day was to save your work (a lesson painfully learnt) and keep your workbook in Google Drive as it automatically saves every few minutes.
Another technical challenge was to plot the first bar chart that shows top 10 Item Types by average Value, then when you click on a bar it drills down to the top 10 items ranked by Average Value. The issue is that if you filter the item by top 10 average value it calculates the top 10 across the whole dataset, not within the item type selected. In order to do this nested filtering, I needed to use a rank table calc and drag that onto filters (initially I tried to use a fixed LOD).
See my dashboard here (Tableau Public only works with 15 million rows so for the purpose of publishing I filtered all the years except 2024).