


Hello! Yesterday, I began my journey in the data school as a part of DS 46. After a day of introductions, and getting set up on computers, today I started my training.
We learned a lot including data architecture, structure and terminology, as well as what questions need to be asked in order to understand a client's needs, and research to do before starting placements.
We ended the day by looking at some visualisations, and re-designing them to extract additional insights.
Here is a visualisation about the national hockey league.
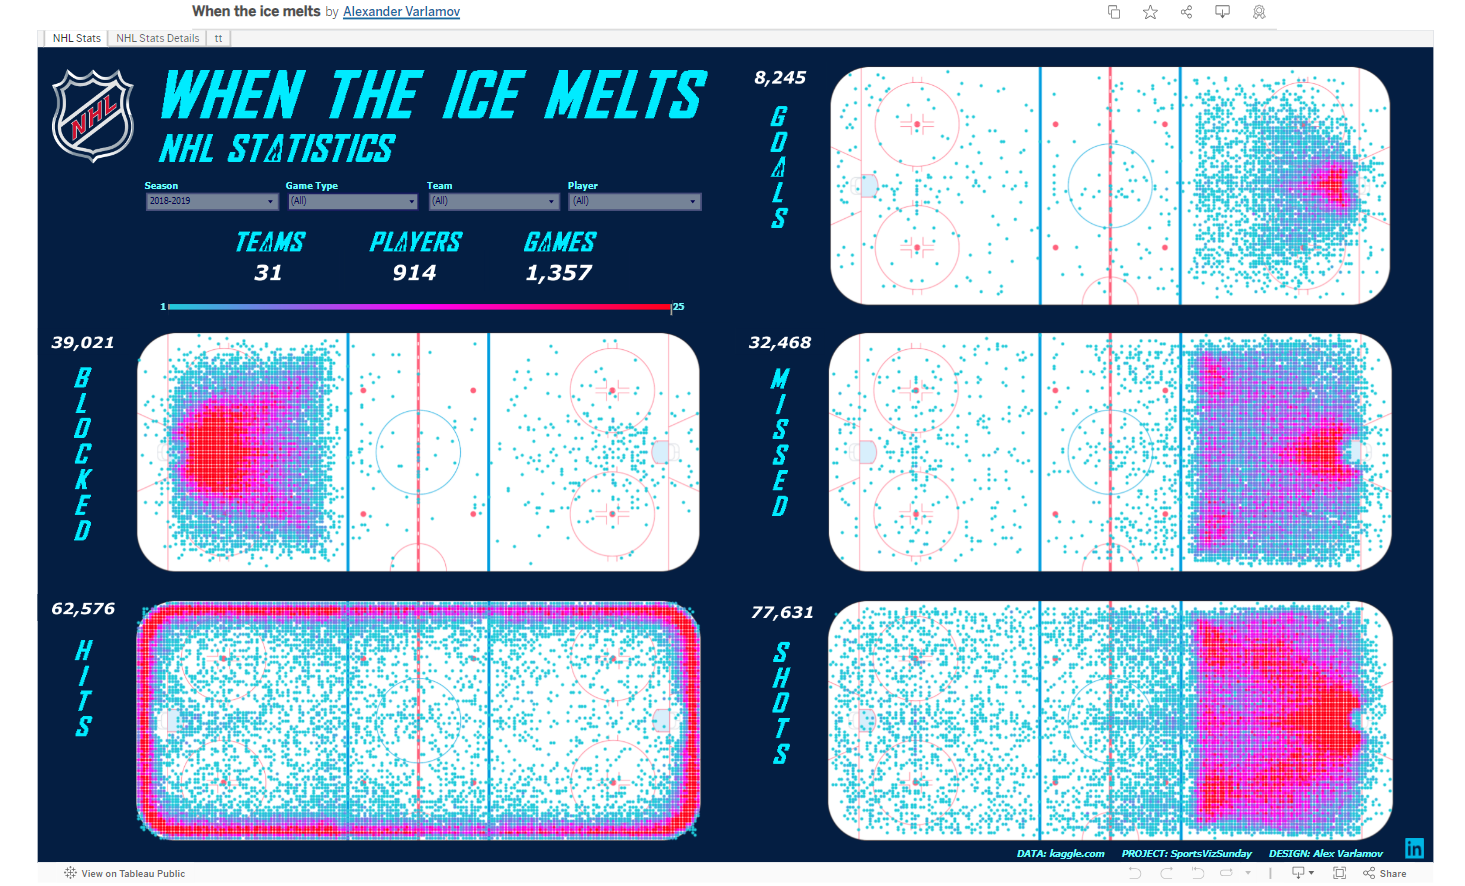
Potential insights:
1) Where on the rink are players most likely to miss a shot from? Where are players most likely to successfully score from?
Why would the stakeholder want this information? To adjust training programs e.g. increase practice of goal shooting from the areas of the rink that shots are most commonly missed.
Below is a rough sketch of my idea:
You can filter by season, whether you want the graphs to show players or teams, and game type (play-off or regular), as well as switching between overall number or rates.
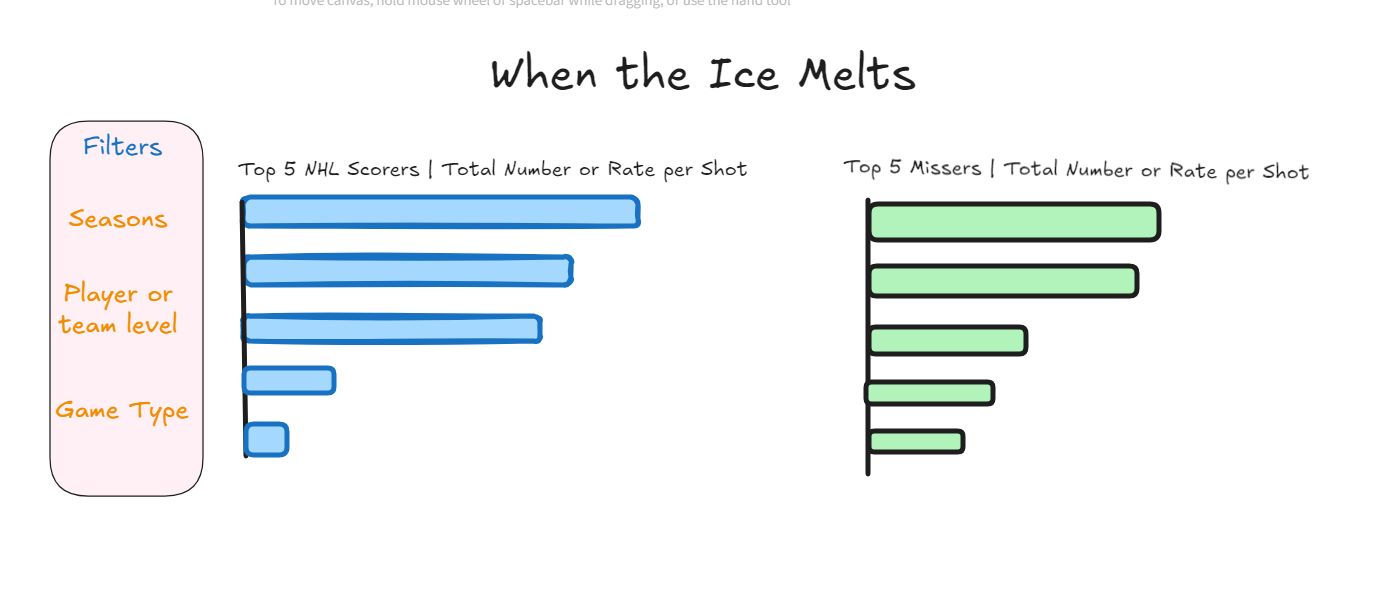
Potential Insights:
1)Who is the best player?
Why does the stakeholder care? Help inform who they should recruit to their team, to inform salary calculations, or how to emulate the best players' training to improve current team members.
2) Who is the best team?
Why does the stakeholder care? Inform which team they should sponsor or bet on, calculate demographics e.g. average team height, average team age, and use this information to put together the best team