


‘Predictive Grouping is an approach that allows users to assess and create the appropriate number of clusters (groups) for their data to be assigned based on their similarity to each other in the same cluster and dissimilar to other data assigned to other clusters.’
Clustering allows you to group data points into different groups that are similar to each other based on a certain number of variables.
Below are the steps used to create clusters in Alteryx. The data set for this example of clustering Beer can be found here.
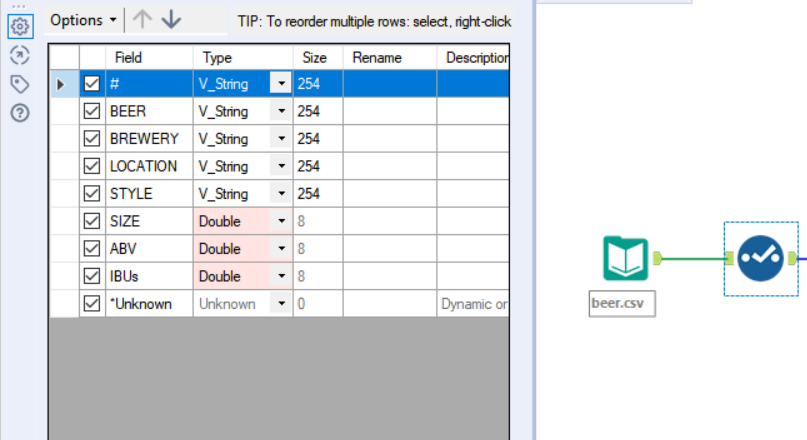
1. Input the csv data file in Alteryx using an input tool.

2. Use a select tool to identify the current data types. One key thing to note is you cannot cluster with a categorical variable. This mean you need to change some of your data types to ‘double’ or to an ‘Int’. In my example, I have changed Size, Abv and IBUs from Strings to Doubles.
3. We need to check if there are any null values and make the decision about what we do with them. In this case, I have used the filter tool to remove any nulls.


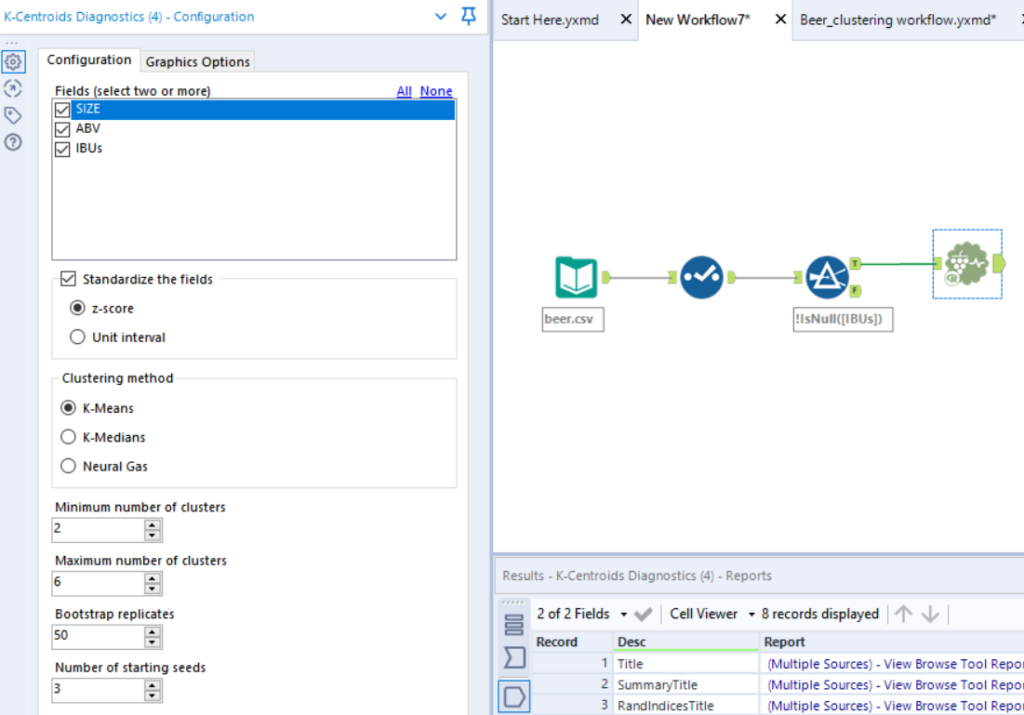
4. Now comes in the predictive tools. We use the K-Centroids Diagnostics tool to help identify the ideal number of clusters to use. This can be found under the ‘Predictive’ tool on the top ribbon.
5. In the configuration window, select the number of fields you want to base your clusters on. You can also select the range of numbers of clusters you want to explore. I have configured this as below. Standardise the fields.
6. Insert a browse tool at the end after the K-Centroids Diagnostics tool. A report will be produced in the left side of the window. Scroll down and you will see two box plot charts (pictured below). The first box plot that appears shows how similar the data points are within groups, you want these values to be as similar as possible. This is indicated by the size of the box, the smaller the box, the closer the values are.
The second box plot shows the difference of points between groups. You want the groups to be as different as possible from each other. This is indicated by the cluster that has the highest median.
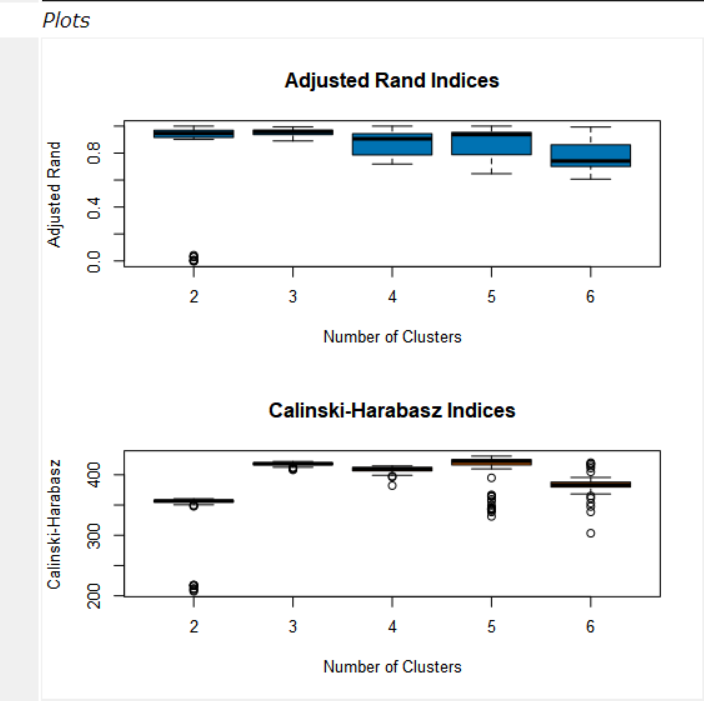

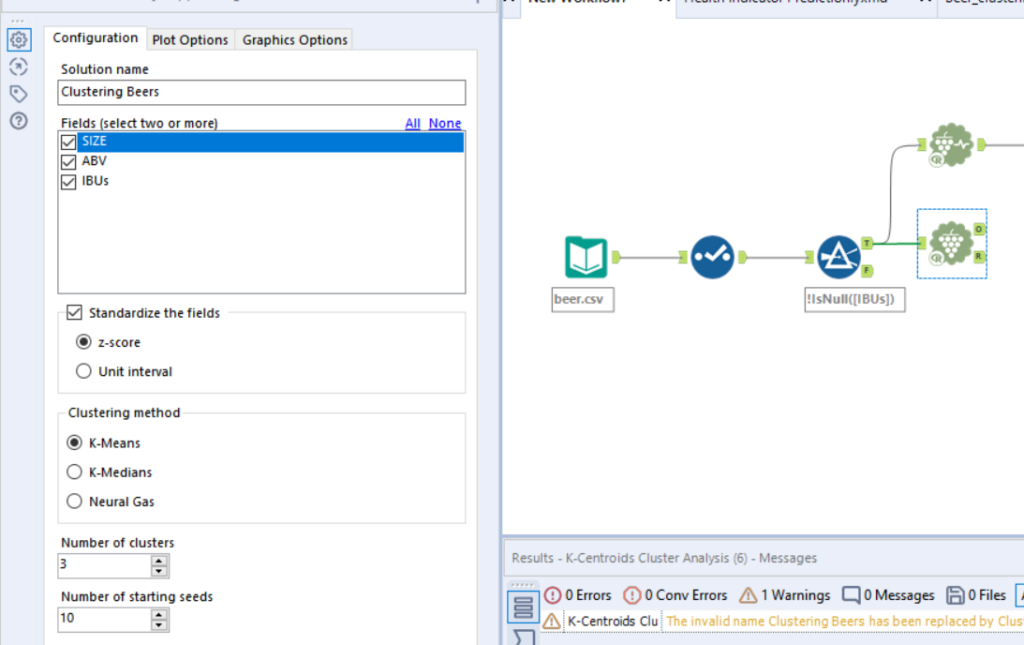
7. In our example 3 clusters looks like the best option. Insert a K-Centroids Analysis tool after our T filter output. In the configuration pane, change the ‘Number of clusters’ field to number of clusters you have chosen to use.

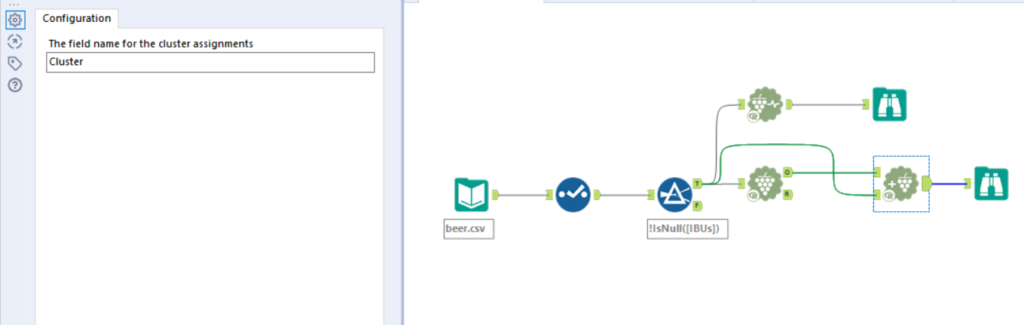
8. The final predictive tool we need to use is the Append Cluster tool. Use the Append cluster tool to connect the full data with the cluster numbers. add the clusters to the original data (data coming out the True side of the filter). Do this by connecting the T from the filter and the O from the K-Centroids Analysis tool into the Append Cluster tool.
If you place a browse tool after the append tool, you will see each row has been assigned to a cluster.
The data is now ready for you to output and to put into Tableau to start exploring!