


Here comes the last week of training, the time has flown by really quickly. For day 1 of dashboard week, we had a task to create a dashboard using the Glasgow City Data about complaints to do with road issues. This dashboard had to be as accessible as possible for all people inclusively.
At first, I started with a plan of the day to make sure that I don't run into issues and have certain things ready by the time it came to present the findings. My plan consisted of a timeline when I should have certain steps completed. It really helped with staying within the time limits - if something wasn't completed within the limit, it's time to move on, otherwise you won't have much to present at the end.
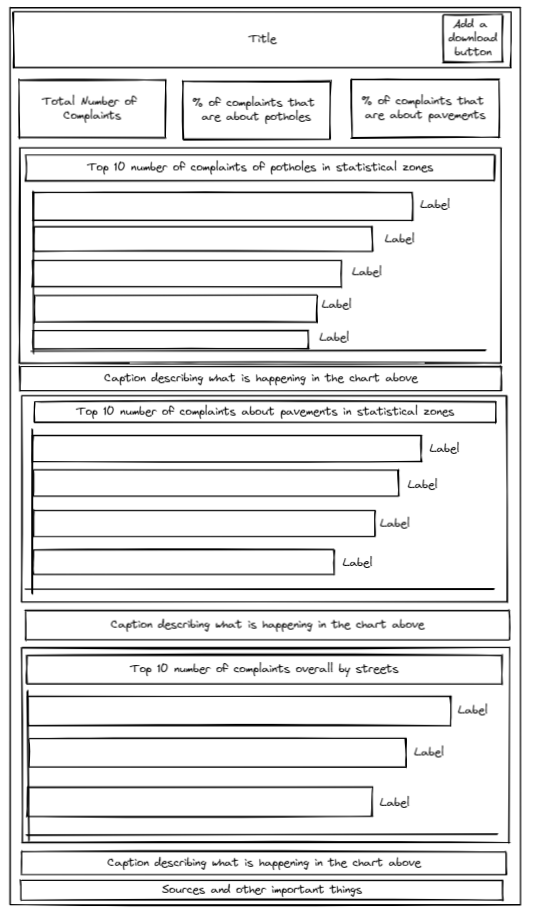
After the plan was done, I looked through the data and drew a sketch of how I wanted my dashboard to look like, which turned out to be like this:
Once the sketch and data prep were done, it was time to build some views. For the KPIs, I made sure that I put the numbers in the Title so that a screen reader can read what it says as it cannot read what is on the sheet itself. To get around the fact that something had to be on the sheet for the numbers to appear in the Title, I coloured the text in the same colour as the background and just made it really small.
For the charts, I ended up using bar charts as it was the most effective way to present the data. Also, I used the same font for everything. If I needed to emphasise anything, I made it bold so that it will be easier to read. I made all of the charts using the same colour to, once again, make it easier to read.
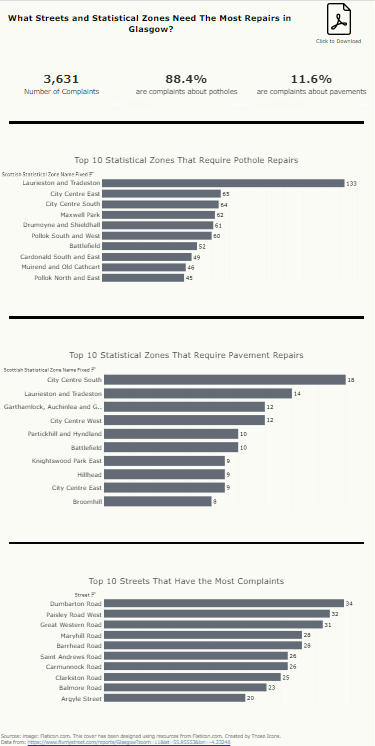
After the views were built, I put them all together in a dashboard. This is how the dashboard ended up looking:
The font that I chose to use is Verdana. This is because this is a sans serif font, and it would make it easier for the reader to read the dashboard as the additional lines in the letters would distract the brain from the overall shape of the letter.
The reason why my dashboard has a coloured background is because for some people white can appear as too dazzling and the guide suggested to use cream or pastel colours as a background to make it softer. The guide is here: guide.
The reason I picked the green shade for the pastel coloured background is to do with contrast. I made sure to check the colours against a colour contrast checker to make sure that they work well together, and this is what the results were:
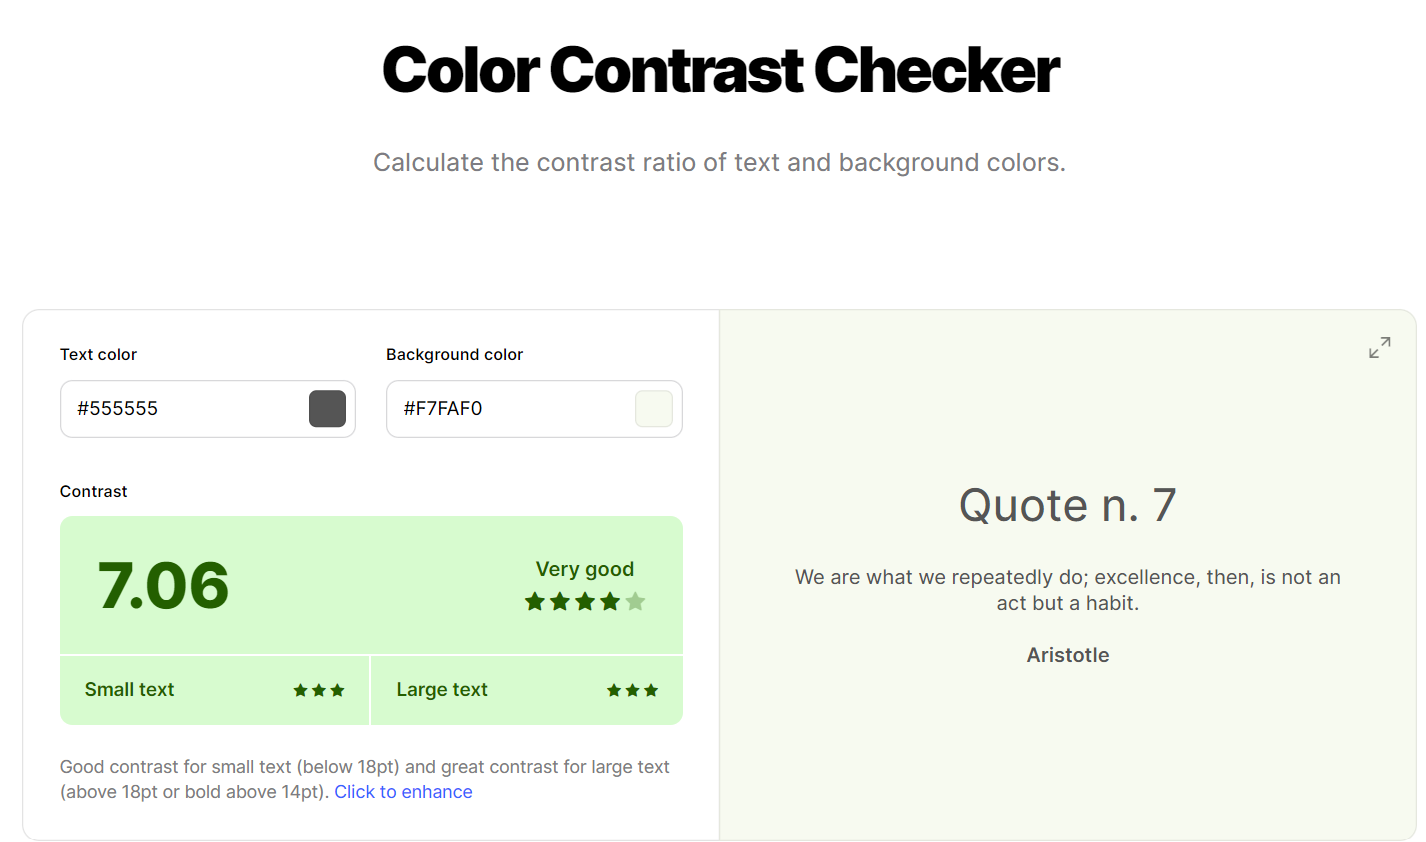
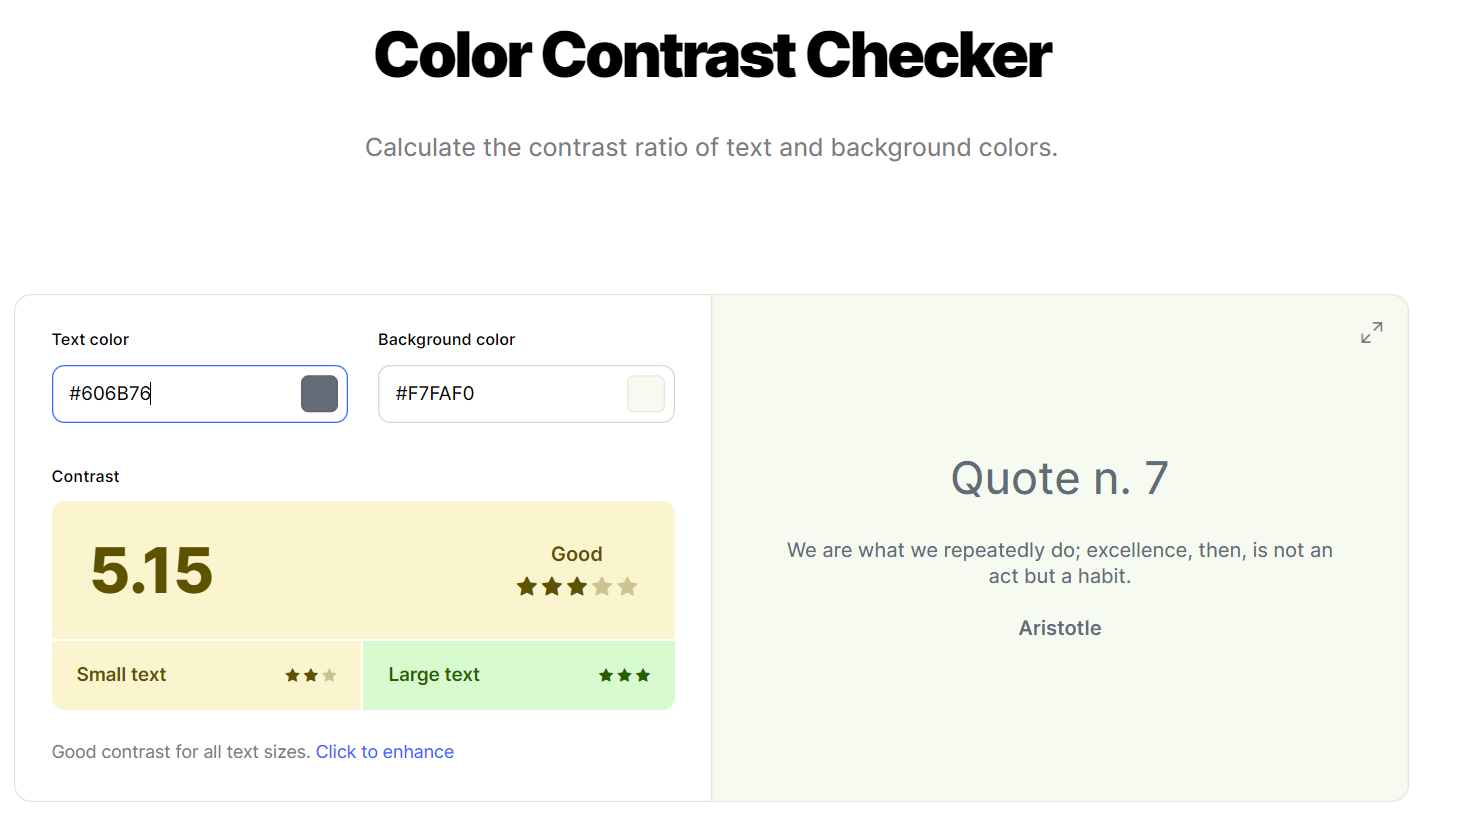
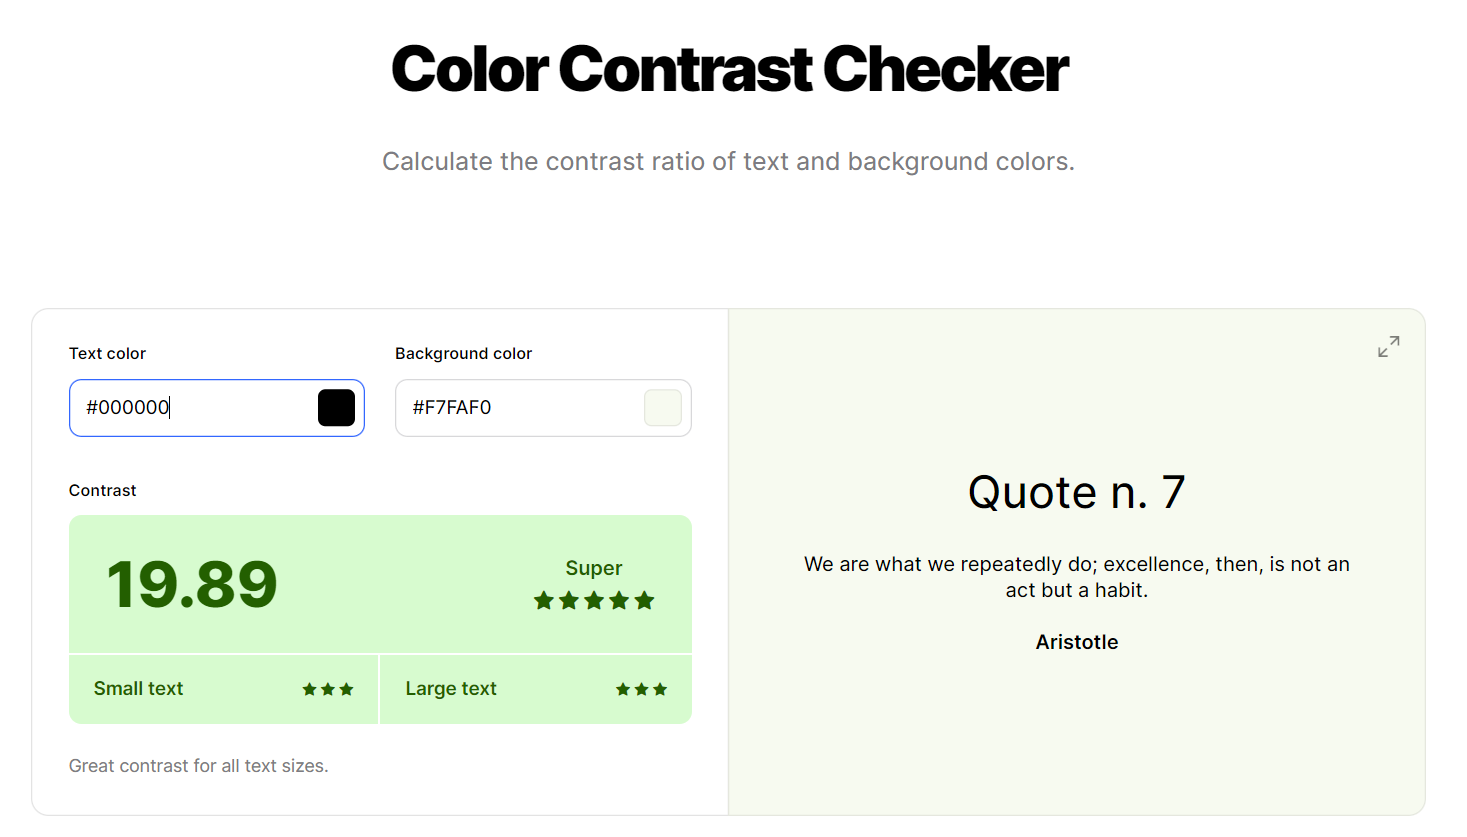
All of the colours got good or very good which worked out well. I put in different shades to make sure that the colours work well with each other until I made my decision.
I also made sure that I checked the dashboard against different types of colourblindness and these were the results:
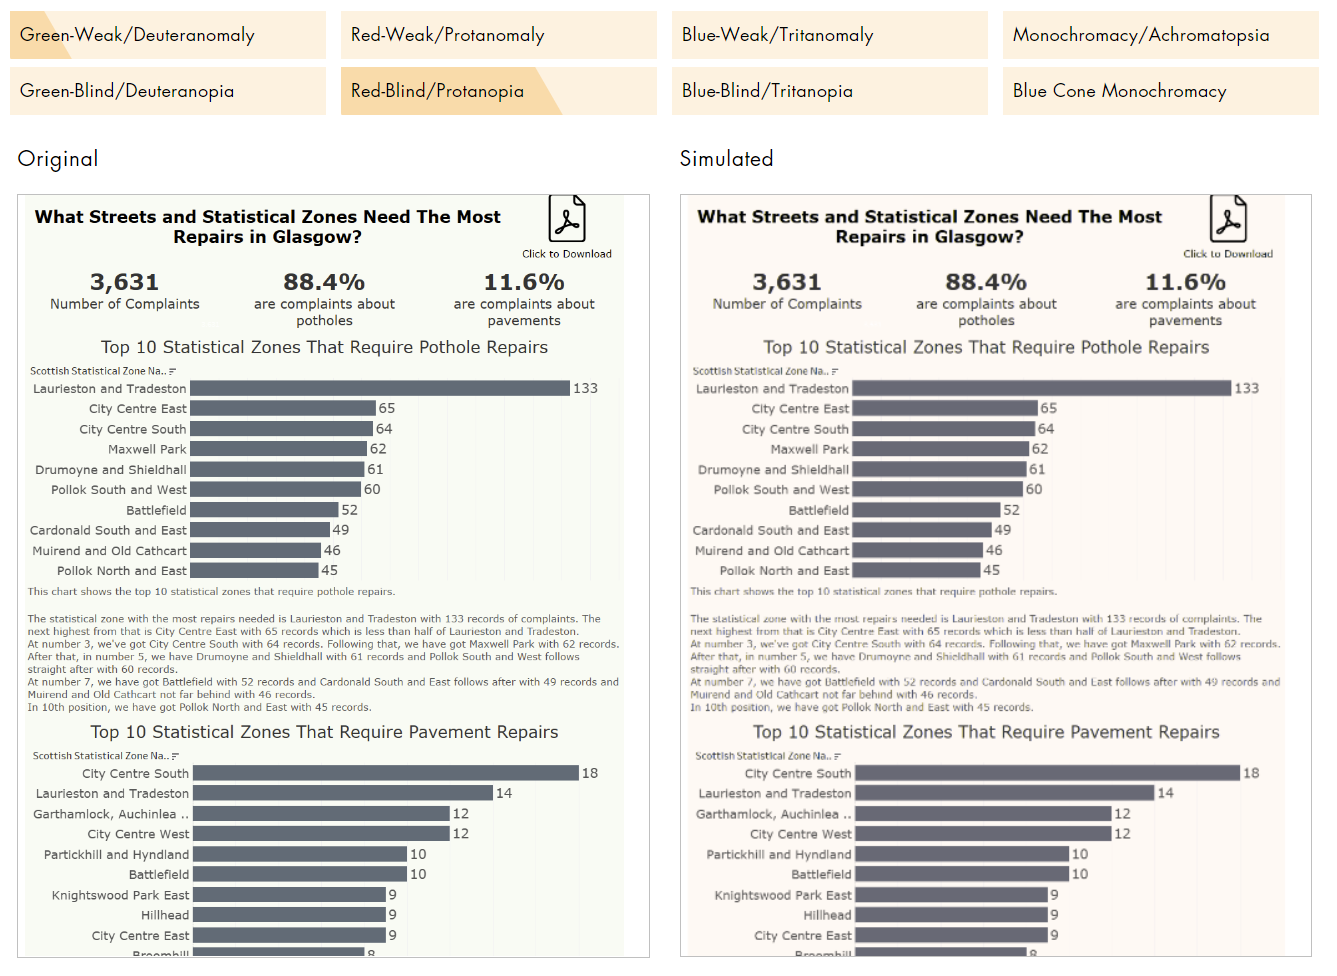
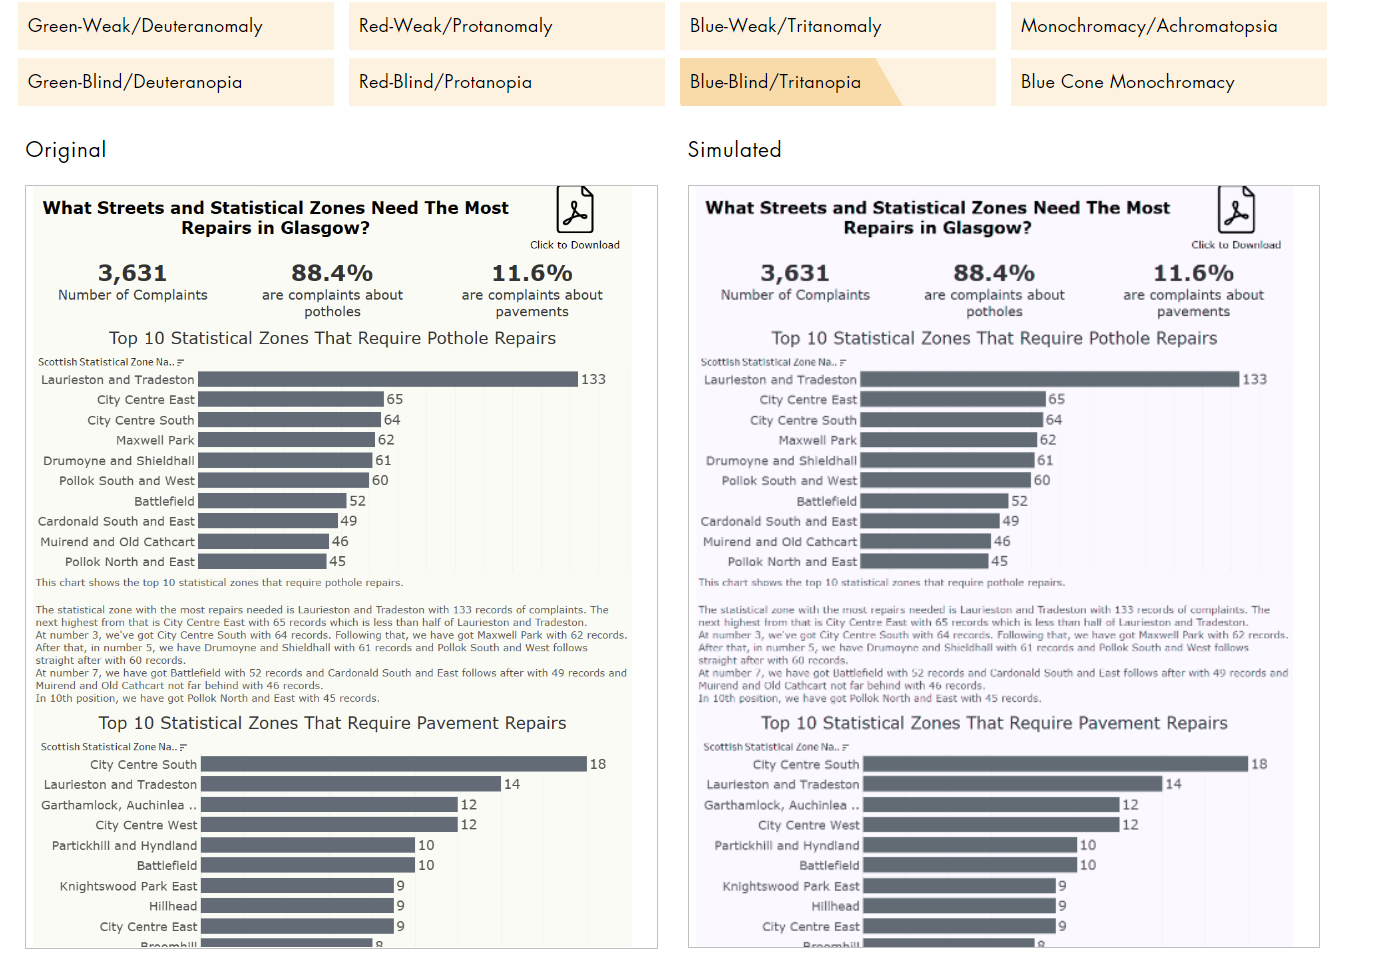
This also shows that people with colourblindness will be able to read this dashboard. (This was checked through all of the options).
Finally, the final result of my dashboard does not seem to have captions, but they are there. To make it more visually appealing and for people to be able to use a screen reader and understand what is going on, I blended the captions with the background. This was then double checked that it works with a narrator option, which it does.
The dashboard navigates well with the use of Tab button, so it will be well usable with people who cannot use a mouse to navigate. For that reason, nothing was added in the tooltip.
Here's the link to the dashboard on Tableau Public: Accessibility | Tableau Public.