


Day 3 out of 4 of dashboard week and we are visiting the museums. The data consisted of museum information of where the museums are and what type are they and even more.
The brief was the same as day 2 and the day consisted of creating a plan, data prepping and then building some insights. Then, if time permitted, create a dashboard.
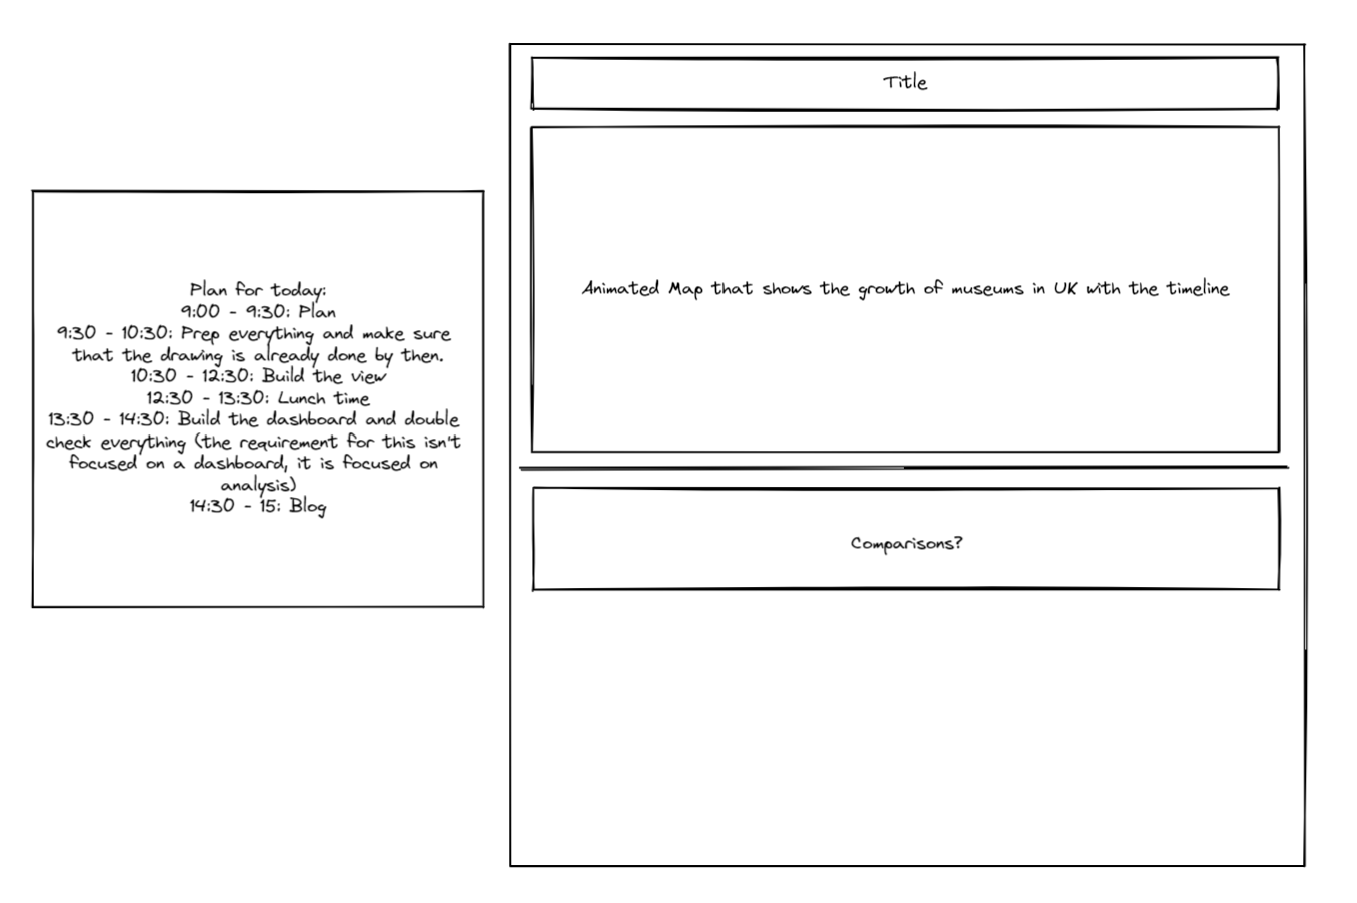
The plan was pretty much the same as previous two days to just sketch, get insights and blog.
After looking at the data, I wanted to kind of do something I have not done before. So, I started to focus on showing the growth of the number of museums. This is how my sketch was:
After drawing the sketch, I put the data into Prep and cleaned the data a little bit.
The prep workflow is pretty simple with just a few clean steps so I won't add it to the blog. After the data prep, I put the data in Tableau and tried to get some analysis out of it.
This is my animated map plus a cumulative chart next to it to see the growth of it:
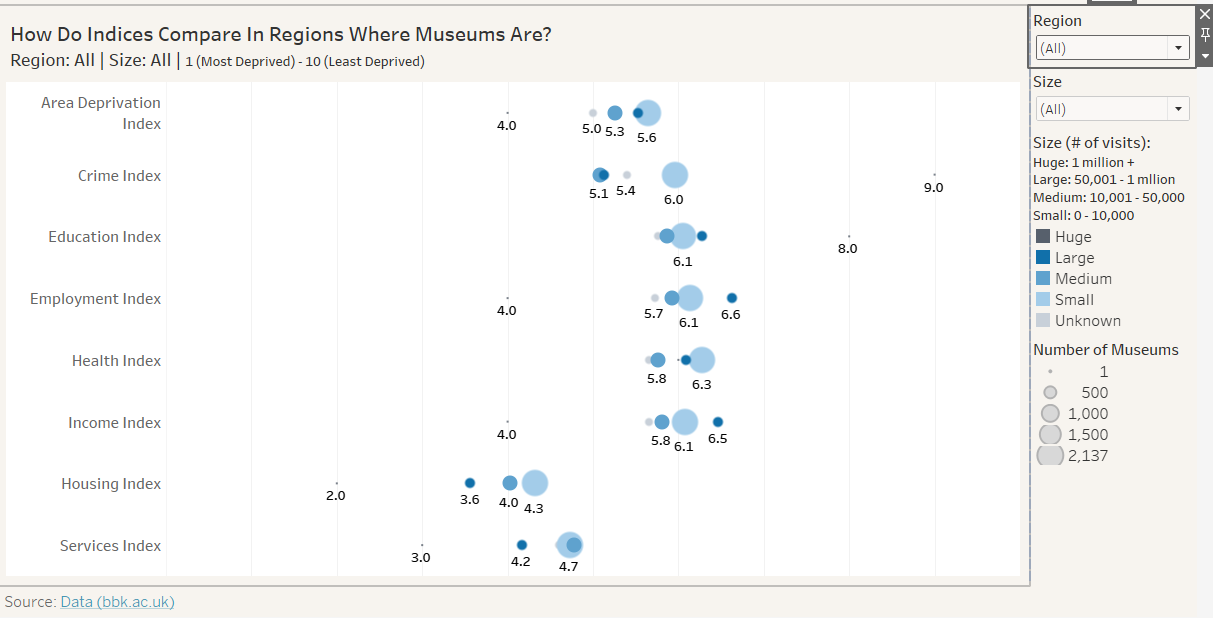
The second chart I created went over a few of ideas until the final chart was made. This is how it looked like:
Overall, the thought process has been much better than it was before, so I think I have learned a lot more today.
Key takeaway from it is to know the question you are trying to answer and then build the chart!