


Week 4 of the Data School started with going back to Tableau! One of the things we have learned today was how to create KPIs - and here's how you can too!
We have used the Superstore dataset that is given in Tableau. We will create the KPIs using different categories of the orders.
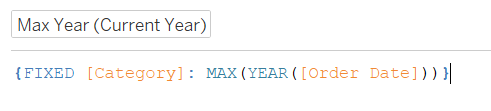
At first, we need to create a calculation field called Max Year. This field includes an LOD calculation as we need to fix the category of what we are trying to find out. So this is what needs to be written:
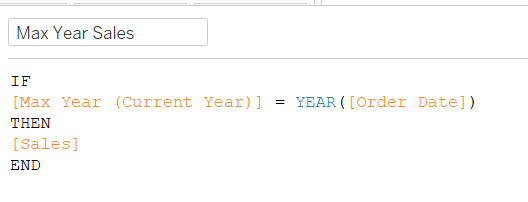
After writing this, we need to create another calculated field to get the sales in this max year that the previous calculation will give us. We can name it as Max Year Sales and the calculation is as follows:
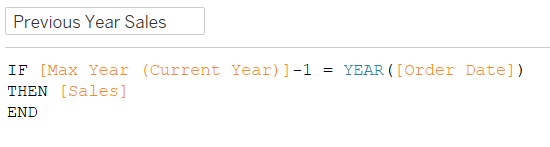
Now, we need another calculated field to give us something to compare it with, i.e. Previous Year Sales, which we can name our calculated field as. In this calculation, we will be taking away a year as we want to compare the previous year to the current year. Here's the calculation:
Finally, we need one more calculated field to calculate the percentage difference between the previous year and the current year. To do this, we will use the two previous fields, Max Year Sales and Previous Year Sales, and combine them in a calculation to give us the result. This is how the calculation looks like:

Here we made sure that none of the values are nulls and just summed them up together in each field.
Now that we have all that we need, we can create the KPIs. Firstly, we will add 'Category' into the columns and then add Max Year Sales, Previous Year Sales and % Difference into the Marks card and on the text. This should give you something that looks like this:

Now, for the final step, we can edit the text so it would show it more nicely of the figures that we need. You can write this in whatever order you prefer as long as it generally makes sense.
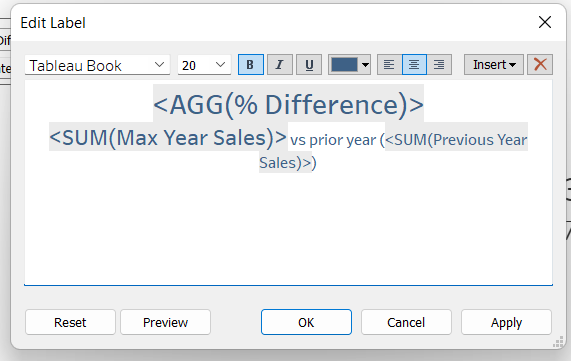
This is the result you should receive:

Finally, to finish, in order to get the arrows, you can format it using a custom format. To do this, Right-Click onto AGG(% Difference), then select Format, and go to the Default part and click Custom. In the little window, you can add the arrows there. However, you have to be careful as Tableau will recognise it as positive, negative and neutral. So this was our choice of format:

Thus, this is how you can create your own KPIs!
Hope this helps!