


The final challenge of DW is an abridged one, with blogs needing to be published and Dashboards complete by 1pm to be ready for an afternoon of presentations. Andy’s weapon of choice today was a dataset containing a month’s worth of US interstate traffic records, which on the face of it was highly promising. As has often been the case however, I was sabotaged by the duo of dirty data and limited time.
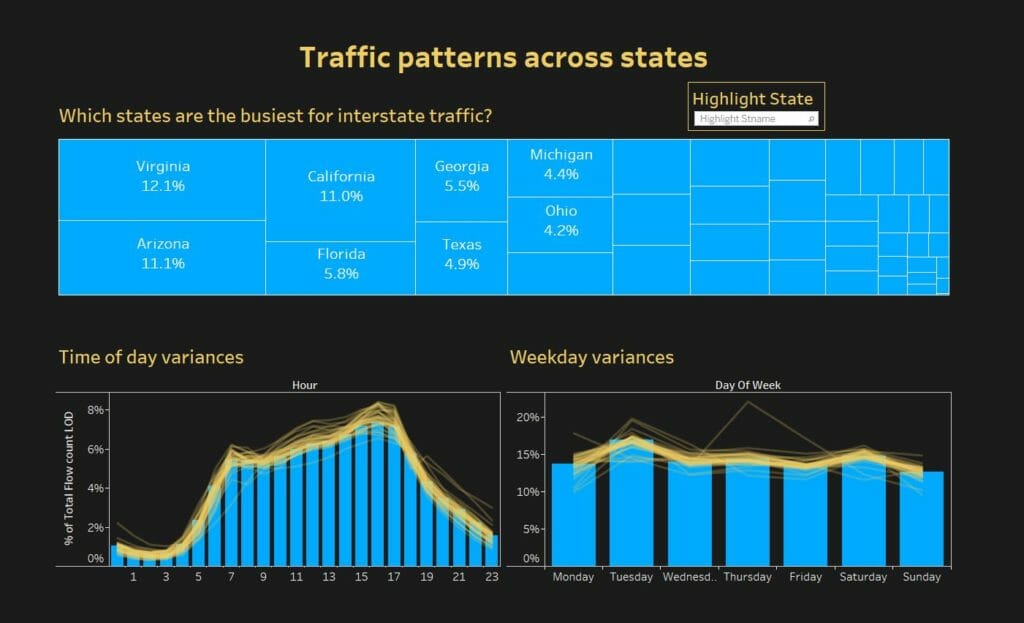
But then again, I suppose that’s the point! I tried to work as quickly as possible to get the data into the right shape for Tableau, relying on the 80-20 rule to reassure myself that though not wholly accurate, the data would be of adequate precision for my viz. I quickly decided that I shouldn’t be led in my design ideas by the original viz that utilised this dataset. As such, I steered away from the temptation to use a map, settling on a more targeted analysis looking at variances in traffic patterns across states.
Farewell Dashboard Week – the rose tinted spectacles are already on but I can honestly say that it’s been a blast.