


The first day of dashboard week required a few steps prior to building a dashboard in Tableau Desktop. The dashboard that would be created in the end was required to be adjusted by way of an alteryx app.
The initial alteryx workflow was not too complicated until I had to use the interface tools to adjust the location and radius to be investigated, and correspond it with the crime ID points. I also had problems when trying to use a list interface to select the crime type and had to settle on a dropdown interface tool instead. My workflow looked like this:
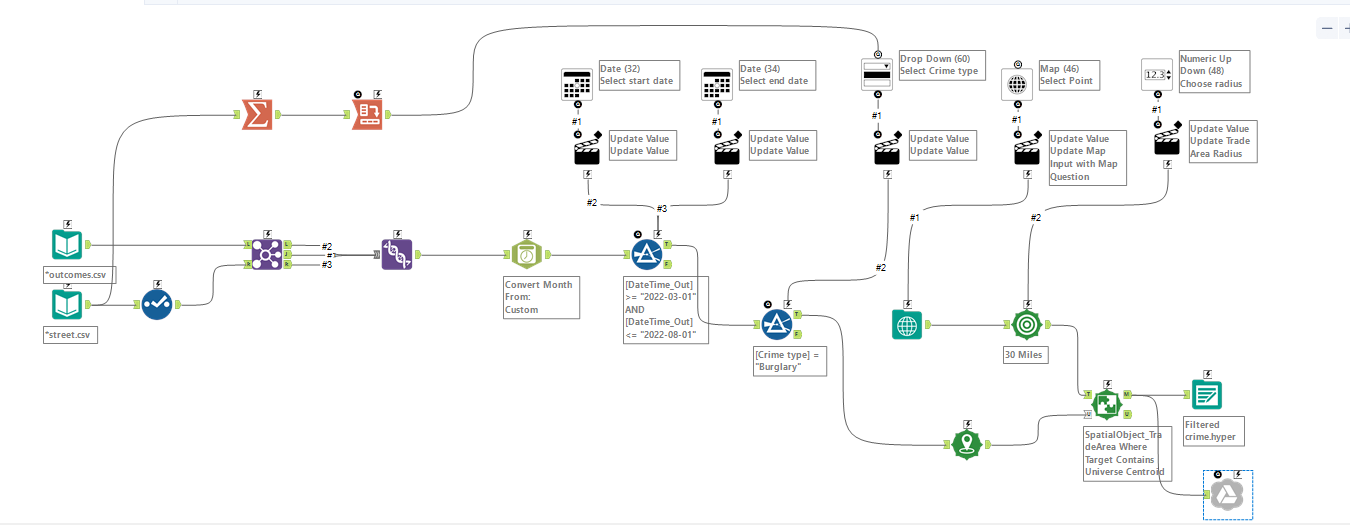
I opted to output into google drive so that the selections form the alteryx app would create a google sheet that would be overwritten every time the app was used. This would then be used as the data source for the dashboard created.
This was the original sketch I had planned for the dashboard that I would make:
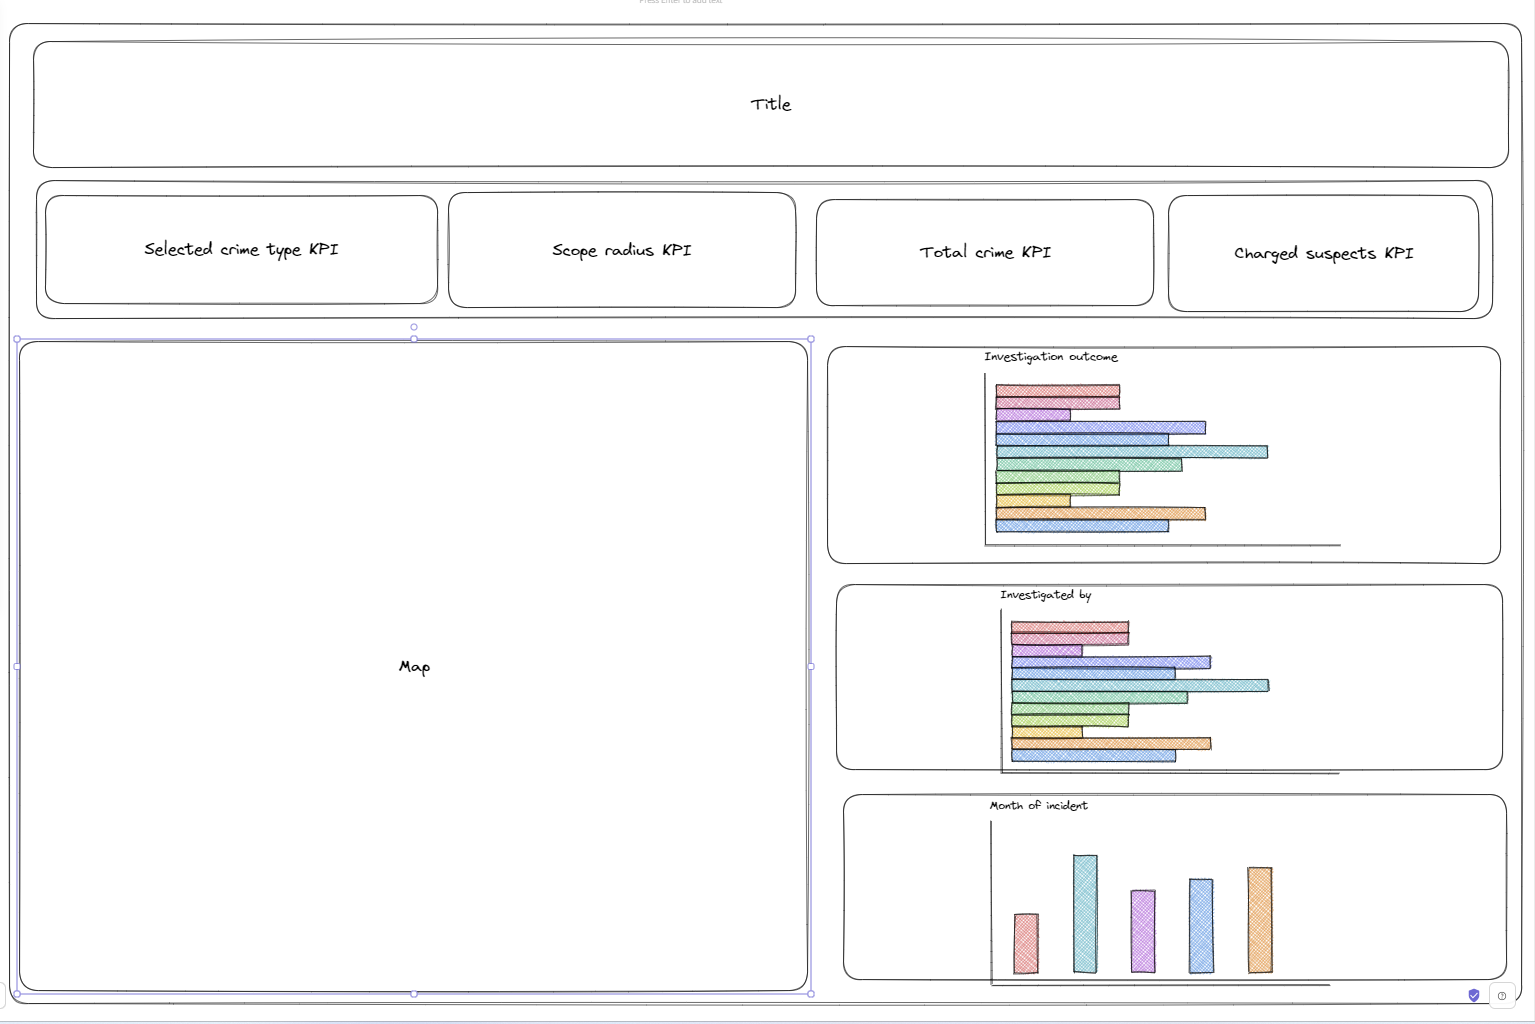
Getting the alteryx app took up most of the day due to spending time troubleshooting. With the workflow and app working I moved onto the dashboard. As the brief specified, my dashboard is high level, with multiple KPIs and a few graphs and a map. With the graphs and map, able to interact with each other and be used as filters.
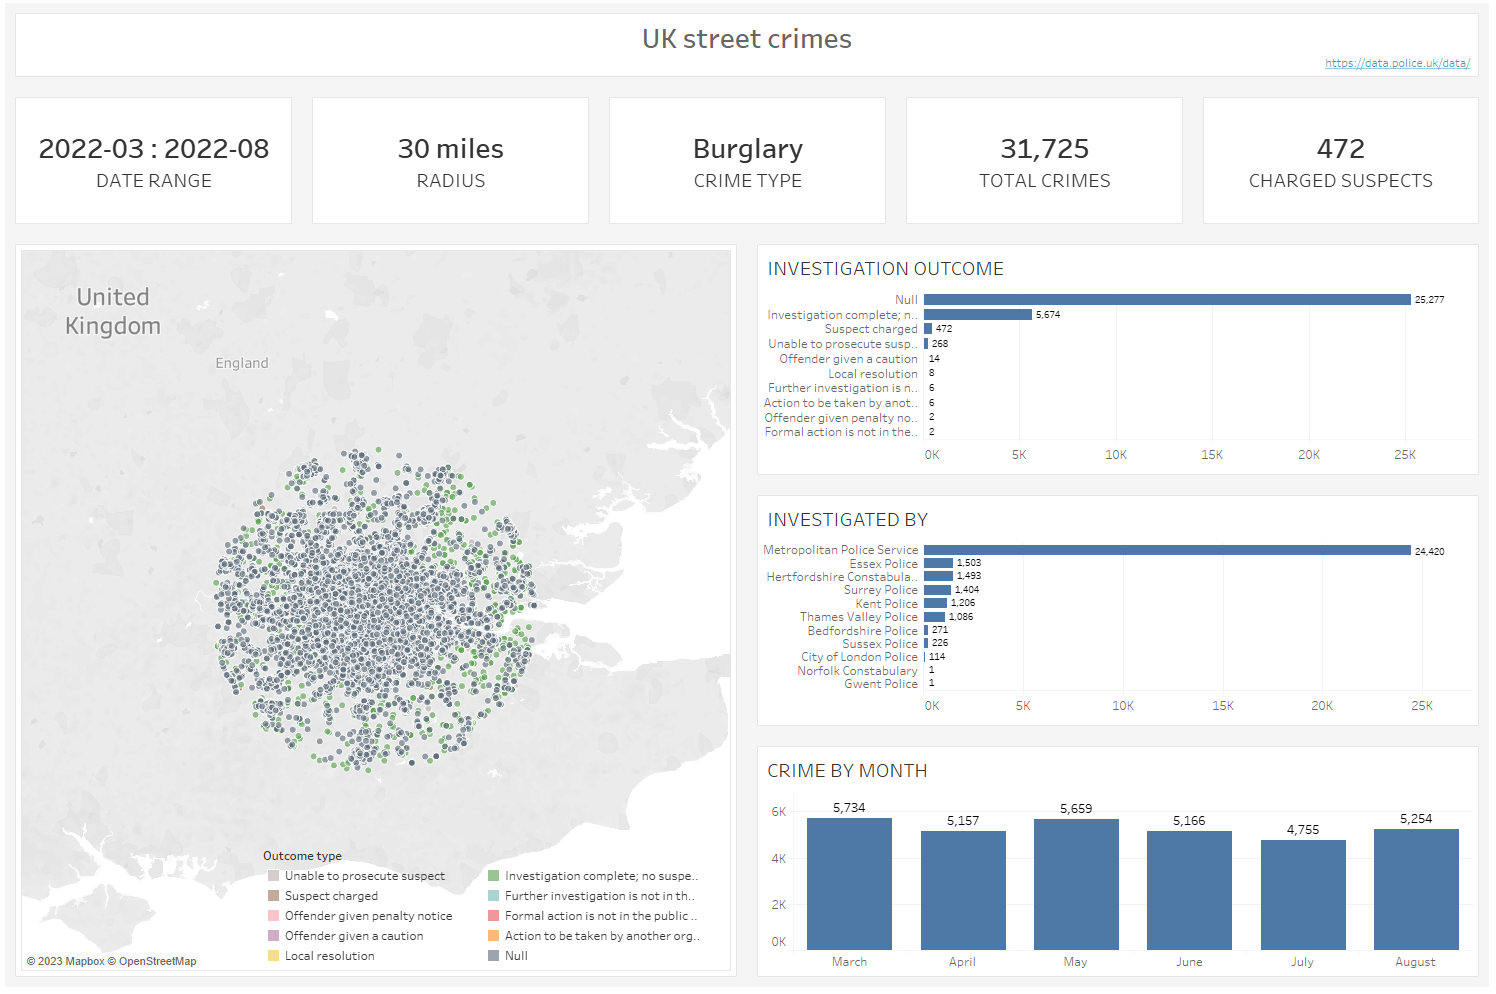
With more time, I would have liked to use the overall data to see how the selected crime type makes up the overall numbers and give this insight on my dashboard. Also I would have tried to incorporate a list box as apposed to a drop down so that you could select multiple crime types.