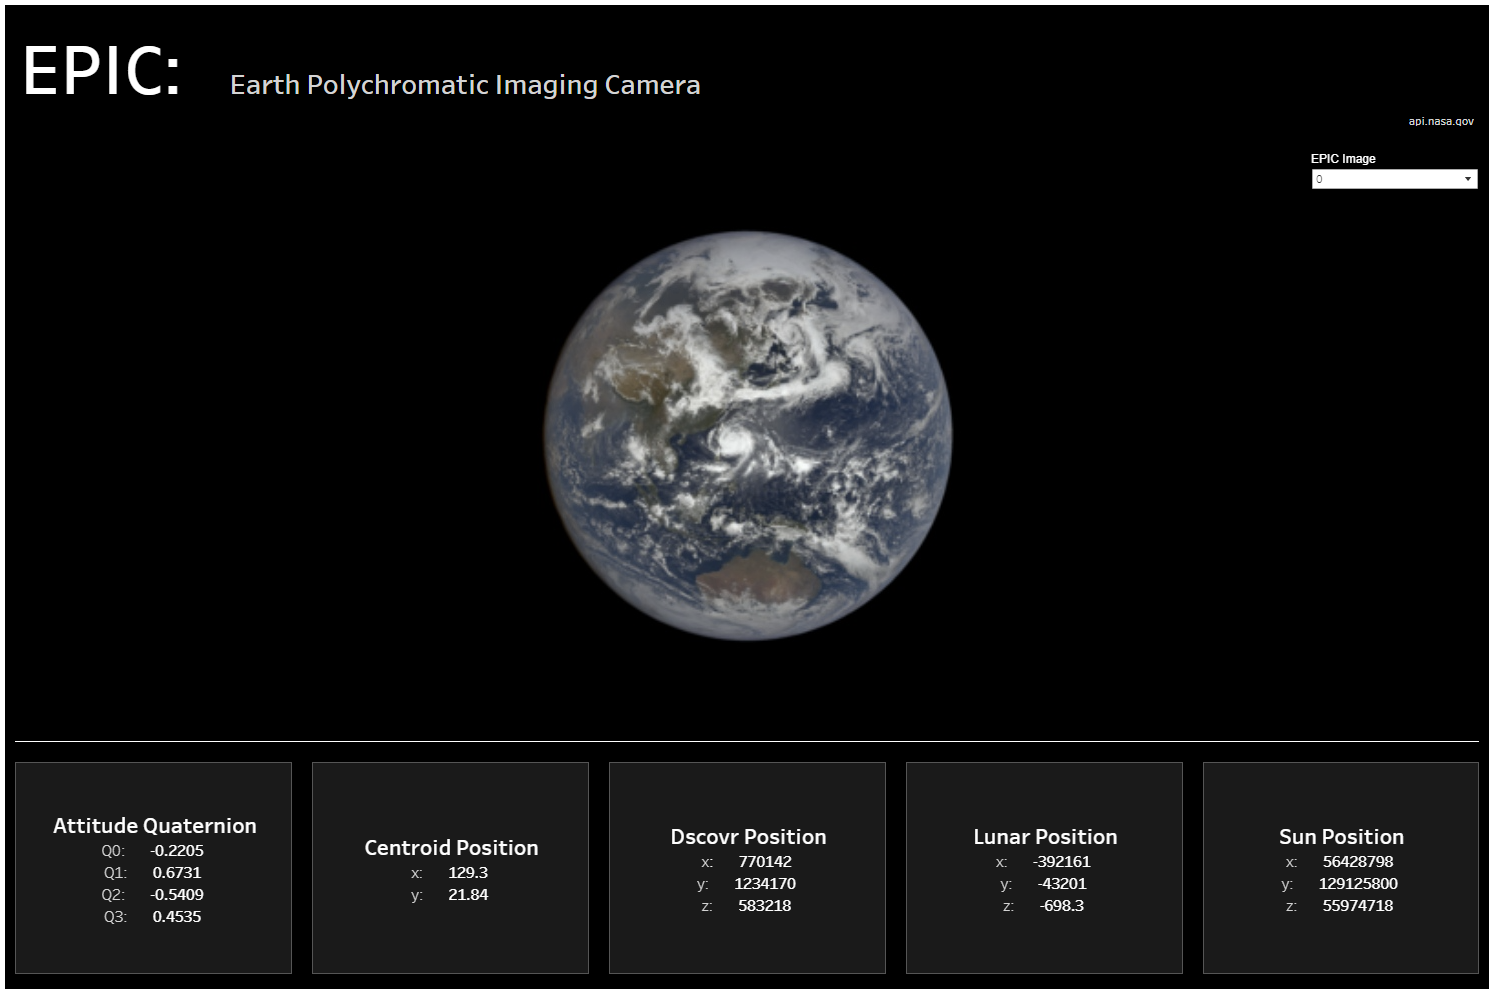
Day 3 had a focus on bringing in data from online via an API. The source was from the NASA API, and I chose the EPIC API. This provided information on the daily imagery collected by DSCOVR's Earth Polychromatic Imaging Camera (EPIC).
Initially the data needed to be drawn from the API, using Alteryx. Then using the JSON parse I was able to draw out the data before flattening.
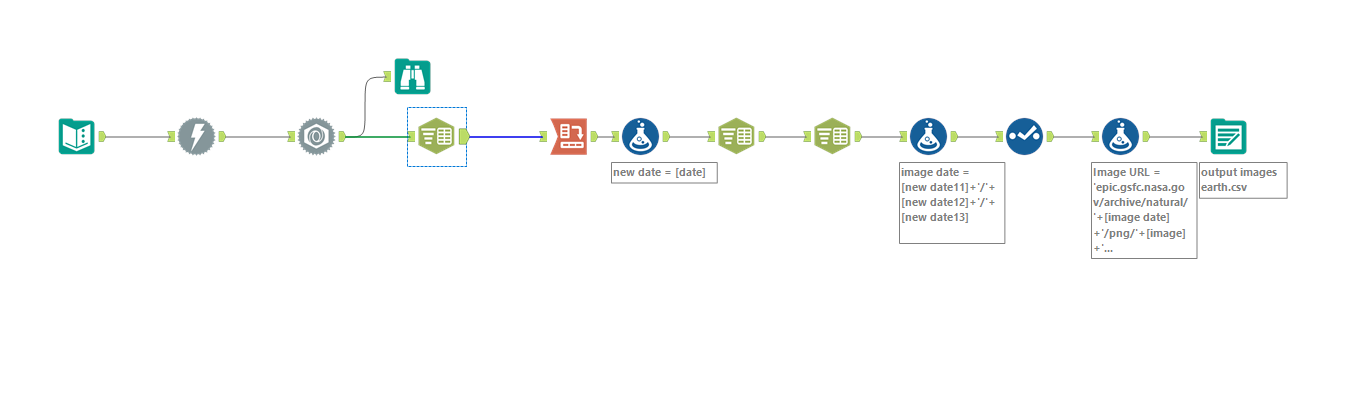
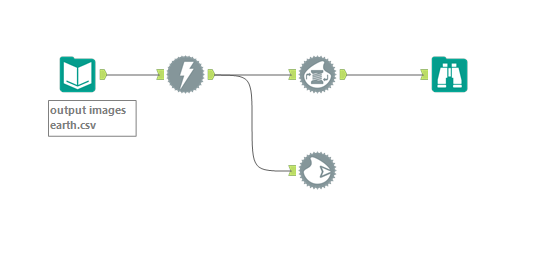
The most complex part of the flow was pulling out the images from the information provided. I had to use formula tools to pull out the date in the right format and join it to a URL as well as the information in the image field provided. From their I could download each of the images at once using the following workflow.
With all the information from the API retrieved I could now start dashboarding. I wanted to create a simple dashboard with the image being the main focus and KPIs to provide some context and additional information about the image taken.
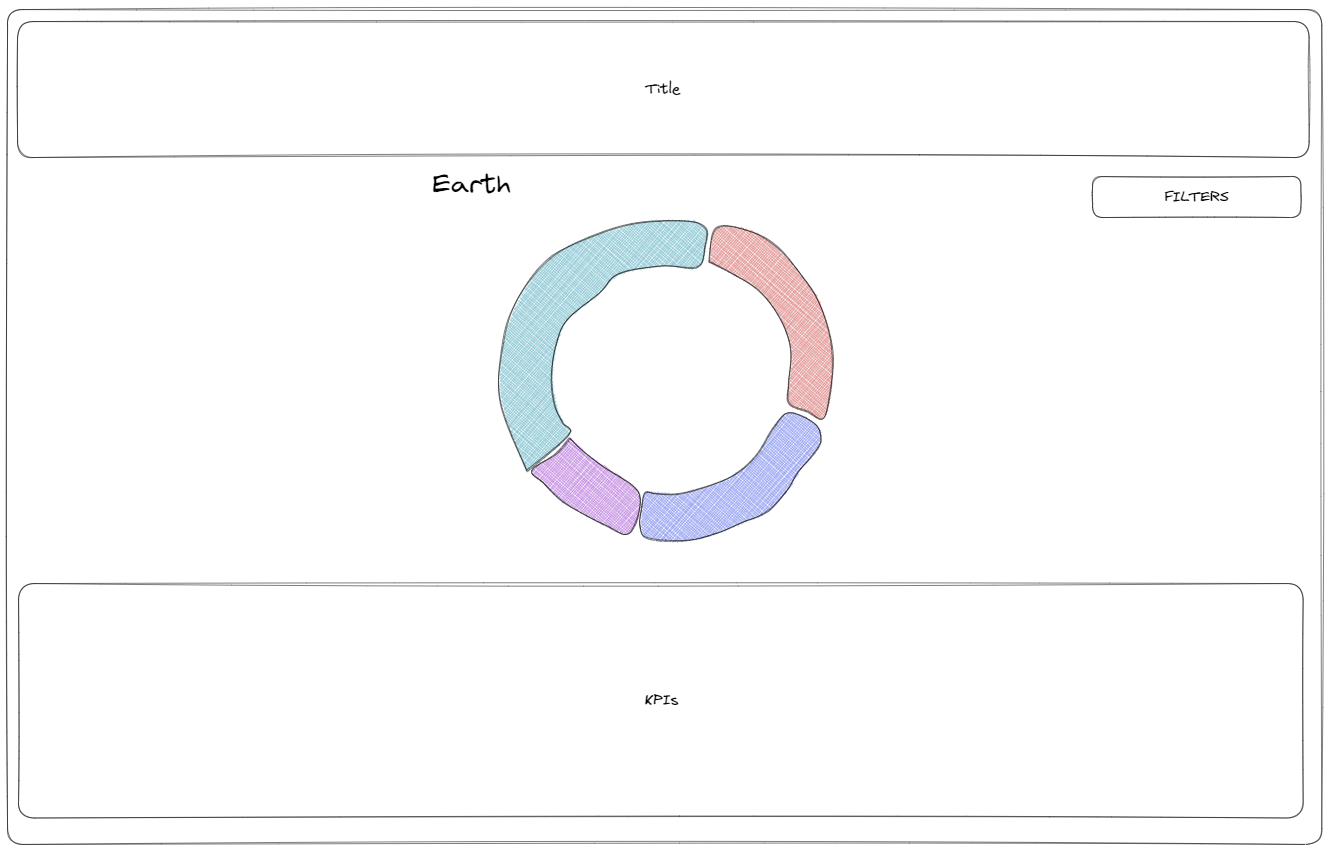
Whilst in Tableau the thing I had most trouble with was bringing in each of the images when the filter tool had selected a particular image. I ended up bringing in each of the images using the Shapes mark type and using custom shapes.