


This two day challenge was all about the movies. We were to submit a dashboard to the Tableau ‘Data + Movies’ challenge. I decided that Thursday (day 4) should be the planning and data prep phase. And the Friday (day 5), more of the building.
We started off IMDB data that we had been provided, which was over a GB in size. So the first step was to narrow the scope… I decided to compare James Bond characters over the course of the franchise. Based on this scope, my Dad has also put a lot of effort into this project over the years, training me up in all things James Bond!
Supplementary information that I web-scraped included:
- James Bonds' kills
- Lovers that died
- Cars driven in the films
- Box Office info: production budget/ takings
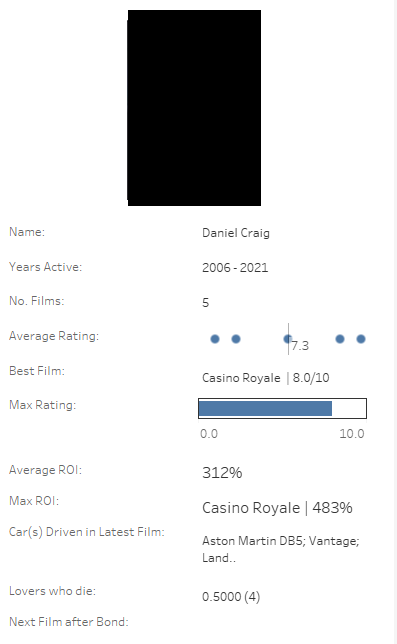
My plan of action at the start of the day was to do James Bond trumps cards, comparing each Bond based on their 'stats'.
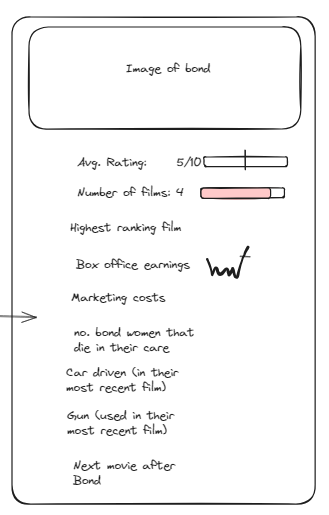
I even mocked up an example card in Tableau...
However, after a lot of thought, I thought it was going to take me too much time to make a card for each bond. I also didn't think there was enough analysis within that idea. So, in true consultant style, it was time to pivot.
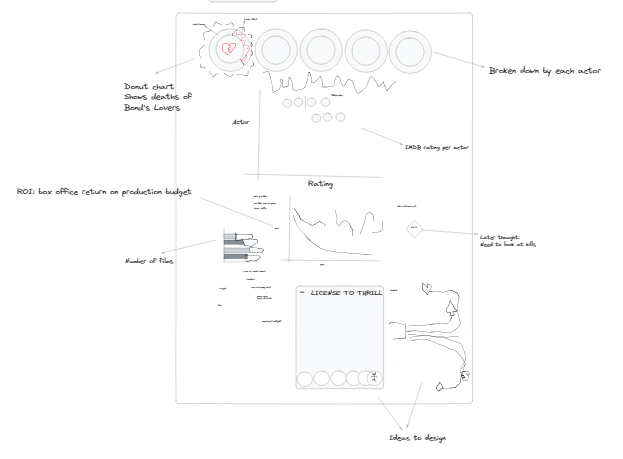
And here's my final product...
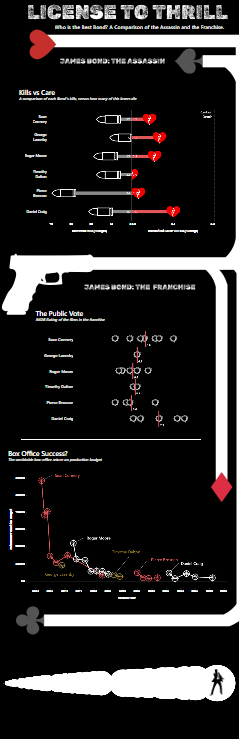

It's on my Tableau Public, so feel free to check it out.