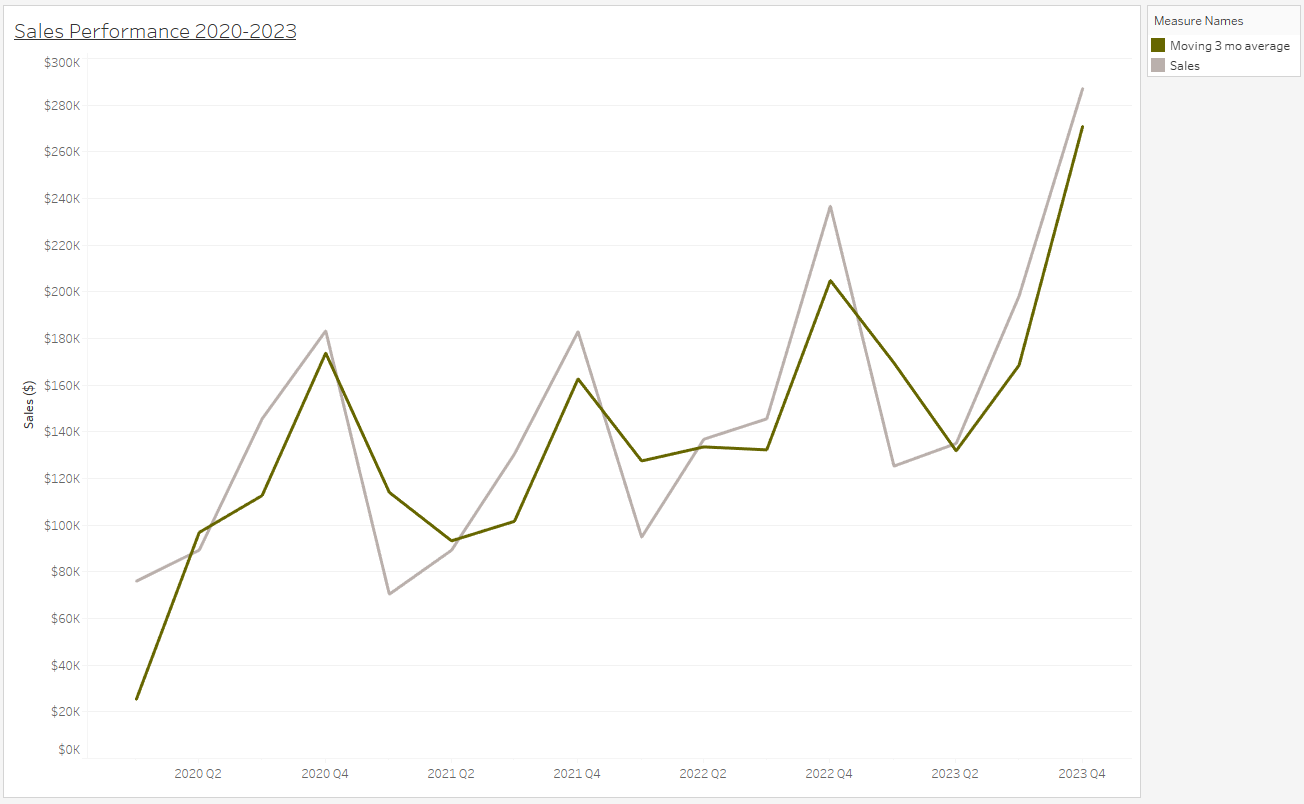
How to use a moving calculation in Tableau Prep.
In the following example, I want to work out is a 3 month moving average in sales. You can do a moving sum or average in this tool. The dataset I have used is as follows...
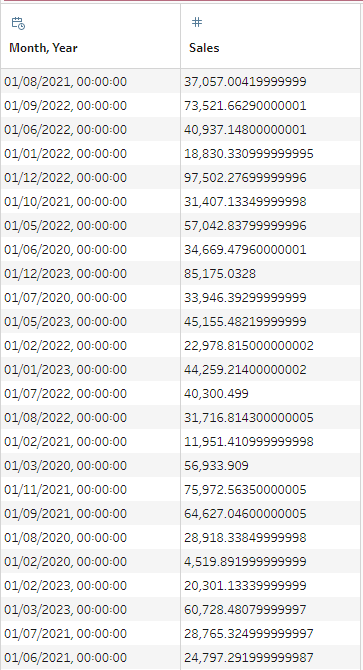
You can follow along if you breakdown your dataset of sales, by month and year. With the superstore dataset, I used a datetrunc() function and an aggregation tool to achieve the above. Each record needs to be an aggregation of sales by month and year.
Locating the Moving Calculation
To access the moving calc window, click the ellipses of the sales field. Scroll down and hover over the 'create calculated field' option, and select moving calculation. The following will appear...
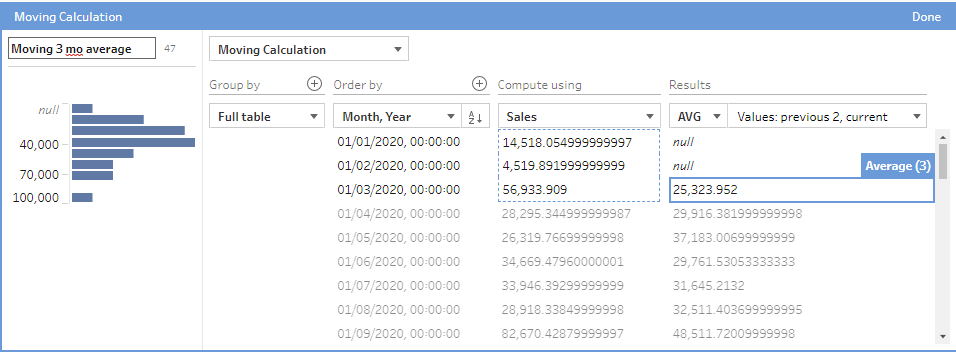
Let's break this down. I find it's easier to start from right to left:
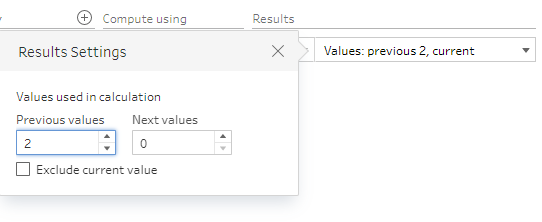
Results: This is the adding bit you want the calculation to do. For this example, we want to set this to the average. We also need to specify the number of values that average calculation needs to consider the last 3 months (the current month and the previous two), which is achieved as follows...
Compute using: This is the numeric field that you want the calculation to happen to. In this example, it is sales.
Order By: This is the date bit that you want to order your calculations by. This is helpful because it orders your dates for you, so you don't need to rank your dates in order before doing your moving calculation. (Make sure you do an ascending order by).
Group By: This partitions your table by specifying what fields' records you want to include in the calculation. You can select one, and click the plus to add more. As we don't want to group by a specific field, we can select 'full table' which allows all records to be considered.
Name the field that you are about to create and click done. The output should look as follows...
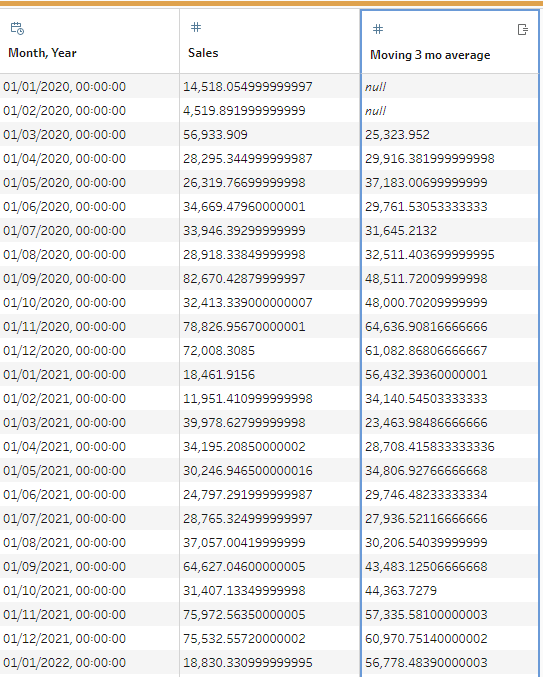
Notice that the first two values in the moving average field are null. This is because a 3 month average cannot be calculated for them, where there aren't 3 months worth of sales yet. Don't panic, these nulls are good sign (for a change!) Now you can output that data, and go make some pretty graphs...