As an 'X', when I 'Y', I want to be able to 'Z'.
Let me explain!
'X' is the user. The person that a prospective consultant like myself needs to be thinking about. Constantly. If you are unsure what the user wants from your input, you need to ask the 5 WHYs? (Literally 'why', five times!) For example, why do want this piece of data analysis? Why?
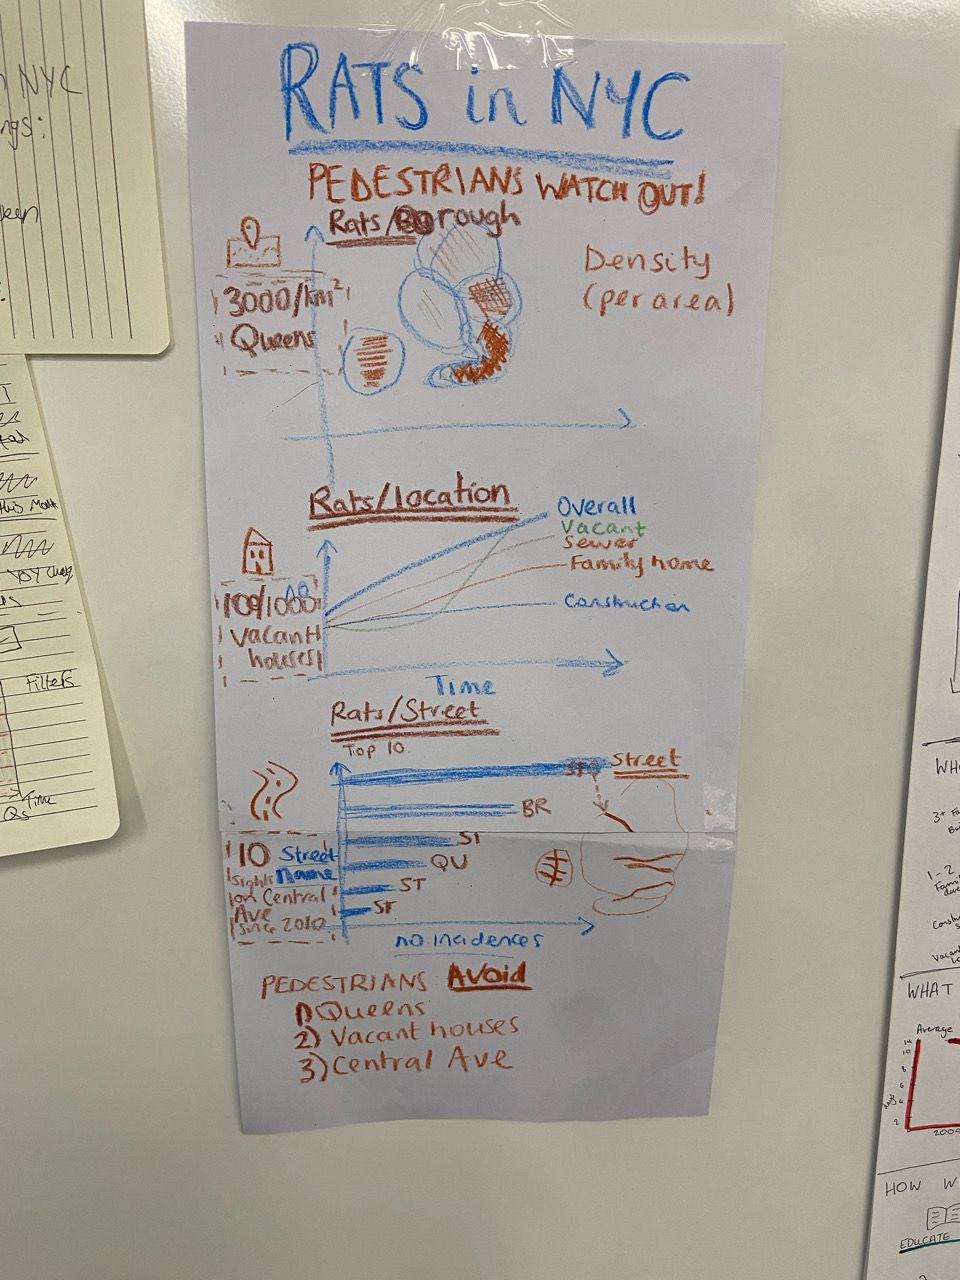
'Y' and 'Z' follow on depending on the user's needs and the scenario. So let me give you one... a dataset on rat exterminations in NYC.
My X, Y and Z is as follows: As a 'passer by', when I 'walk in NYC', I want to be able to 'know how likely I am in encountering a rat!'
The theory is that if you can write this sentence, then you can tailor your sketches, and future visualizations, to the user's requirements. It keeps them in mind throughout, and helps to prevent you from going down a tangent. Every data analyst's kryptonite.
I leave you with my attempt at a sketch of a visualization. Observation number one, crayon is definitely not my media. But hopefully the walkers of NYC would be informed on how to get through a journey, rat-free.