For the fifth and final day of Dashboard Week, we were looking at data from Seattle Transport on Cycling Traffic. We already knew today would be challenging as we only had until 13:30 rather then 15:30 as had been the rest of the week.
The first challenge was to get hold of the data. The links provided took us to a page like below:
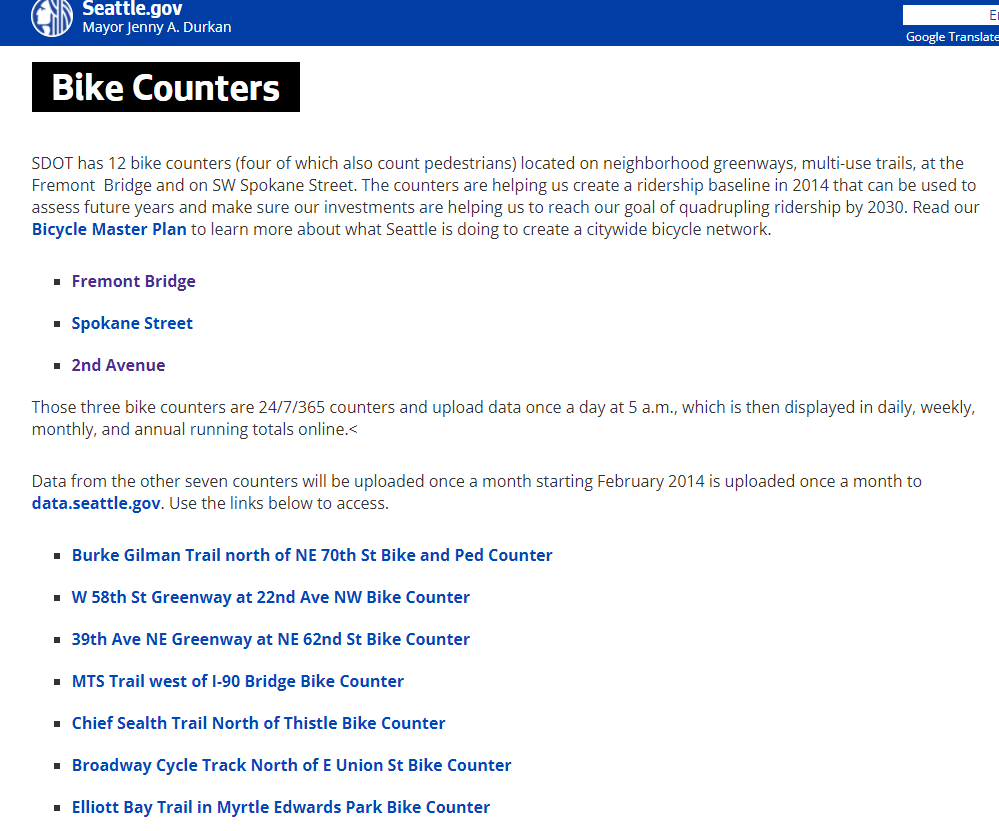
Clicking on one of the top 3 links took me to a Dashboard and map with no indication of how to download the data. However, the other 7 had options to download to .csv or use an API. I chose to use an API for future proofing. Further investigation also found that if I searched the names of the first 3 locations on the data.seattle.gov site, I could also find those APIs.
Attempt 1 - API
Upon inputting the data into Alteryx, I realised this would not be as straightforward as I had hoped. Firstly, the bottom 7 APIs had a mix of Pedestrian and Bike data whereas the top 3 were bike only. I isolated the bottom 7 APIs and built the below workflow with the intention of linking the other 3 up later.
However, after finally producing an output that was compatible with Tableau, we realised that there was a problem with using APIs.
Whilst this looks how I wanted it to, I only have 14K records, which we estimated is way below what we would expect to see for the whole data set - more akin to the number of records for one location for one year. We believe this is due to limits on the number of records that can be generated from a single API call. Although there is almost definitely a work around - it wasn't feasible in the time we had.
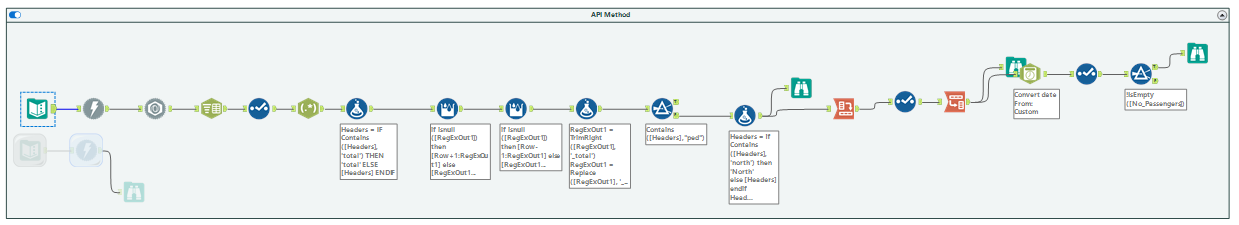
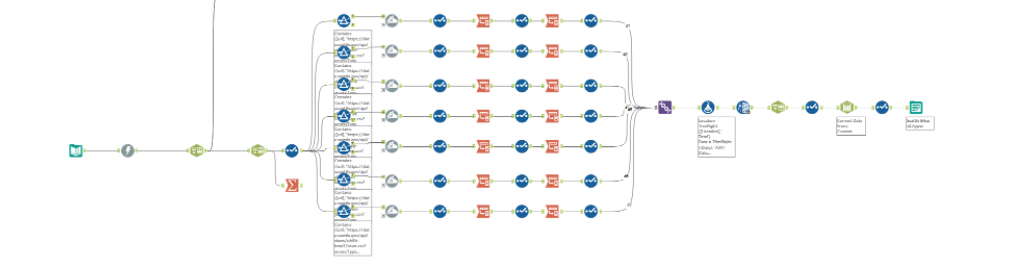
After consulting Lorna, we decided to try and download the csv links directly into Alteryx and parsing them out there. This appeared to generate the complete data set, but it was brought in as concatenated fields and required a lot of prep. As I had already spent 2 hours on the first (now useless) workflow, I had to accept that creating a Dashboard was not likely in the time we had.
Attempt 2 - CSV URL
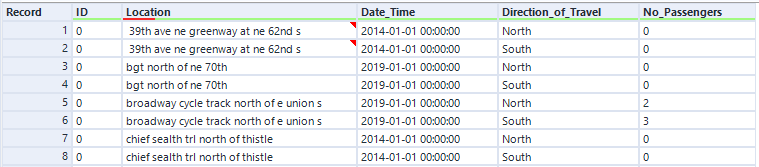
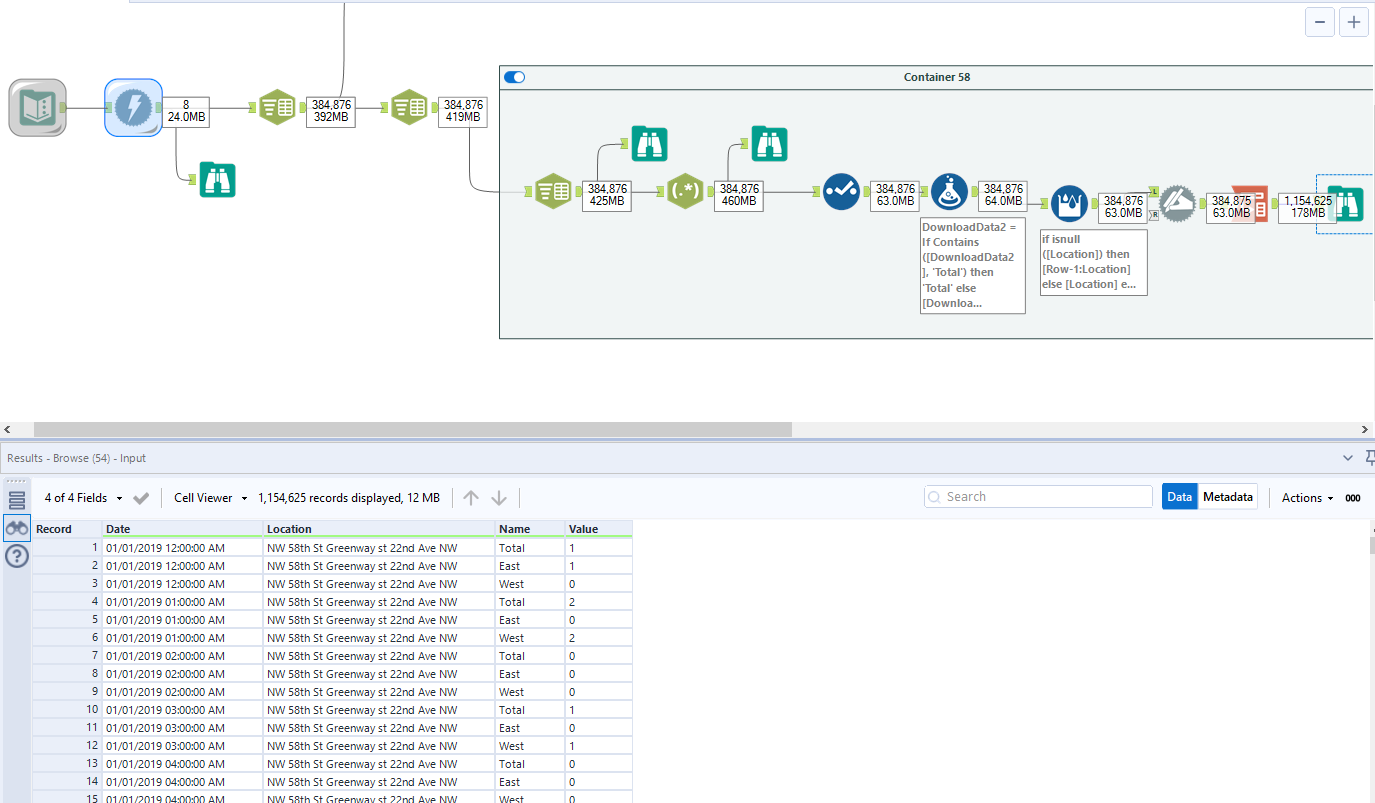
This workflow produced what I thought was the correct output. However, when I looked in the browse tool I found that several values were still concatenated hidden in the depths of the data, so with half an hour remaining I needed to go back and check my parsing.
Attempt 3 - Incomplete
Unfortunately time ran out before I could work out my solutions. Although I wasn't successful, this was a great exercise for me in terms of Alteryx Tools and Troubleshooting my own workflows. It will be interesting to see what the rest of DS24 came up with!
Although this was no great triumph to finish training with, I realised in the process of muddling through how much I have learned in the past 4 months!
After the Presentation
During our presentation I got the chance to see the other workflows that had been produced - I think where I went wrong was attempting to bring in all the URLs in one input tool and clean them all together. The method that seems to have worked is to bring each URL in separately and clean each one according to it's schema. Ideally we could have used a basic macro to speed up the process, however due to the differences in schema this wasn't possible.
After the presentation I spent some time looking through other workflows and trying to better understand how that would fit into my workflow. This was also where I went wrong this morning, I was trying to incorporate these ideas into my pre-existing workflow rather than starting again which should have been my course of action.
I worked with George to replicate his workflow and get some data to use in Tableau. This is something I should have also done this morning but chose to focus on Alteryx rather than using someone else's data.
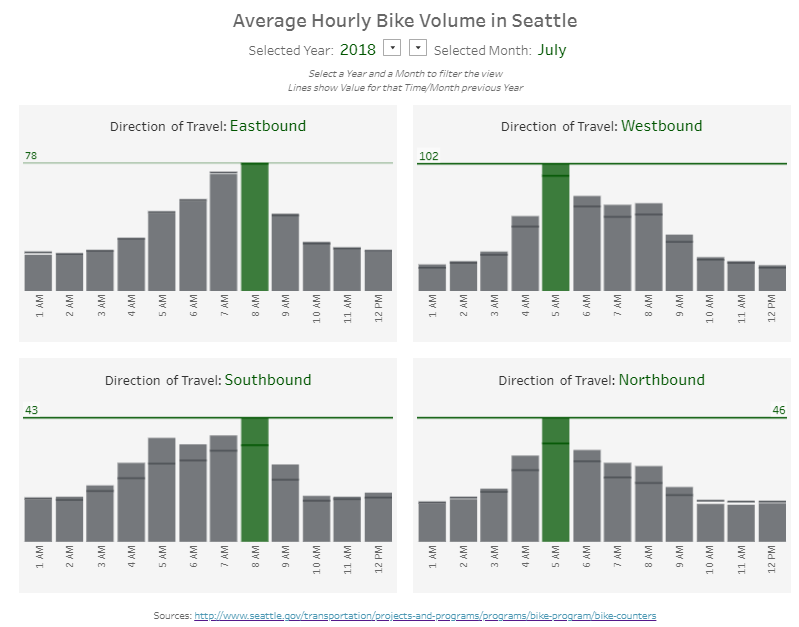
Using this data, I made a KPI dashboard, choosing to show hourly trends per year and per month for each location of travel.