


For the final day of dashboard week, we were asked to perform our data preparation in SQL and take a look at LEGO data from Rebrickable to create a dashboard in a different software to what we used on Monday, which meant I would be building it in Tableau.
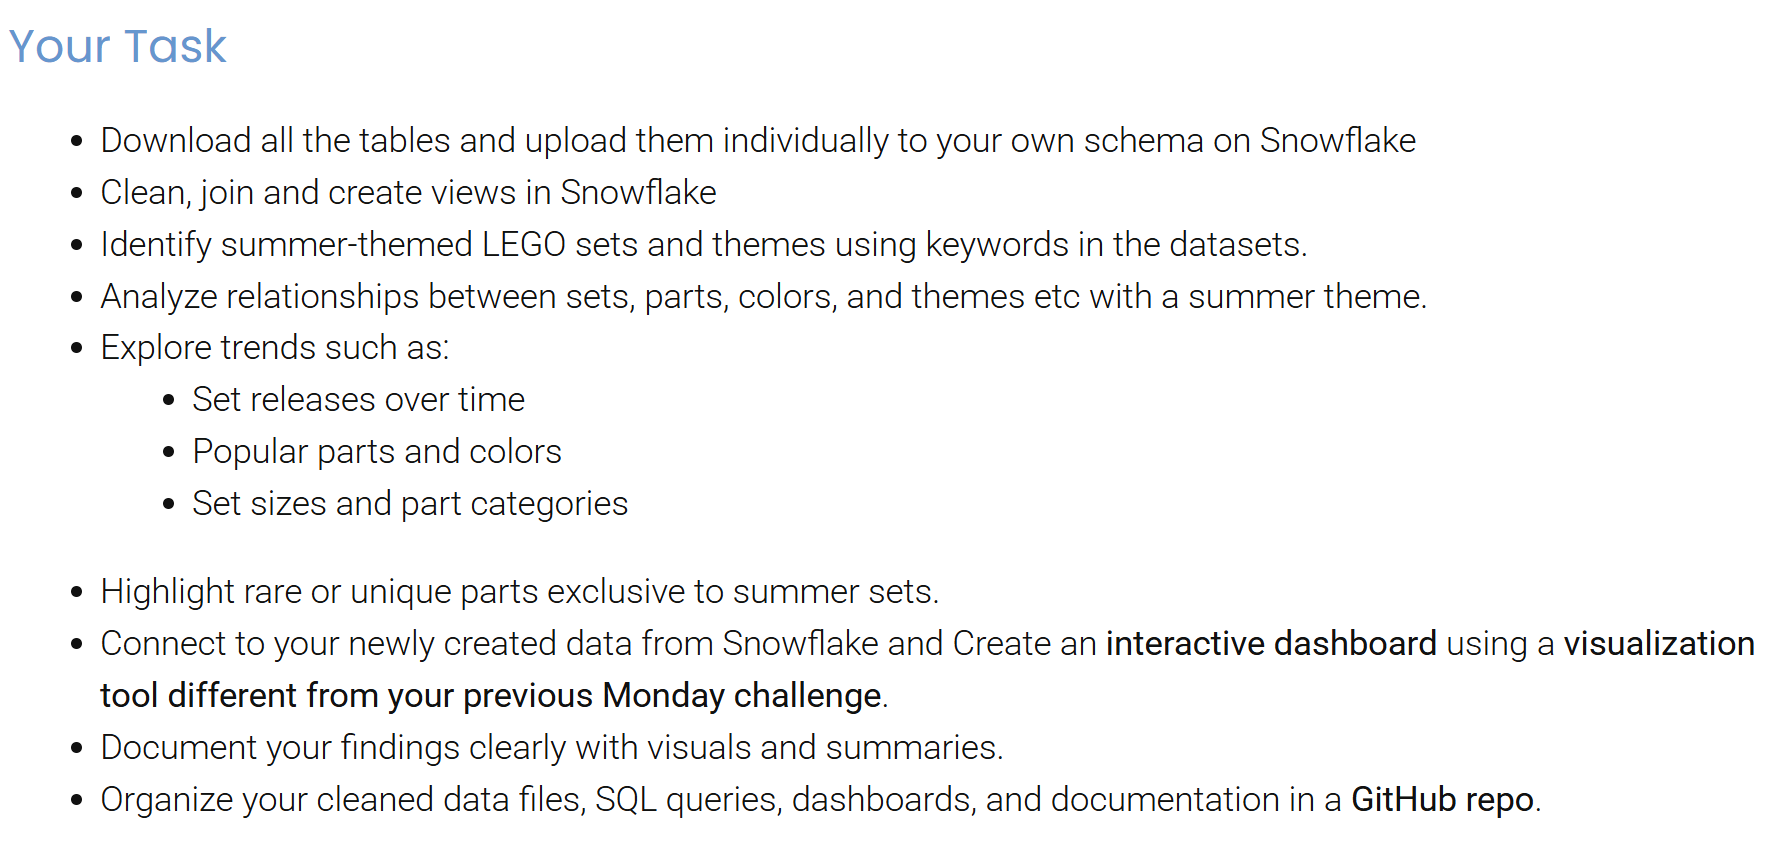
The Brief
The Process
I was a bit apprehensive about using SQL again after a while of not looking at it. With this, I didn't have a concrete plan in mind but took each step as I went. In hindsight, planning everything would have been best, but this experience has definitely helped shape my understanding of how to approach this in the future.
The steps taken for this challenge were:
- Download the data from website
- Create schema on Snowflake
- Upload data onto schema
- Find relevant tables to use – also decide what filters to use
- Join all necessary tables together and filter down my data
- Connect Tableau to data
- Plan and dashboard
SQL Data Cleaning
Luckily, Rebrickable provided a data schema to have a look at.

As the schema branched off into three directions, I decided to create three tables based on:
- Minifigures
- Sets
- Parts
With this, I needed to ensure the inventory ID was kept across all three to build relationships in Tableau.
In SQL, I created all three tables within one worksheet as three separate queries, as follows:
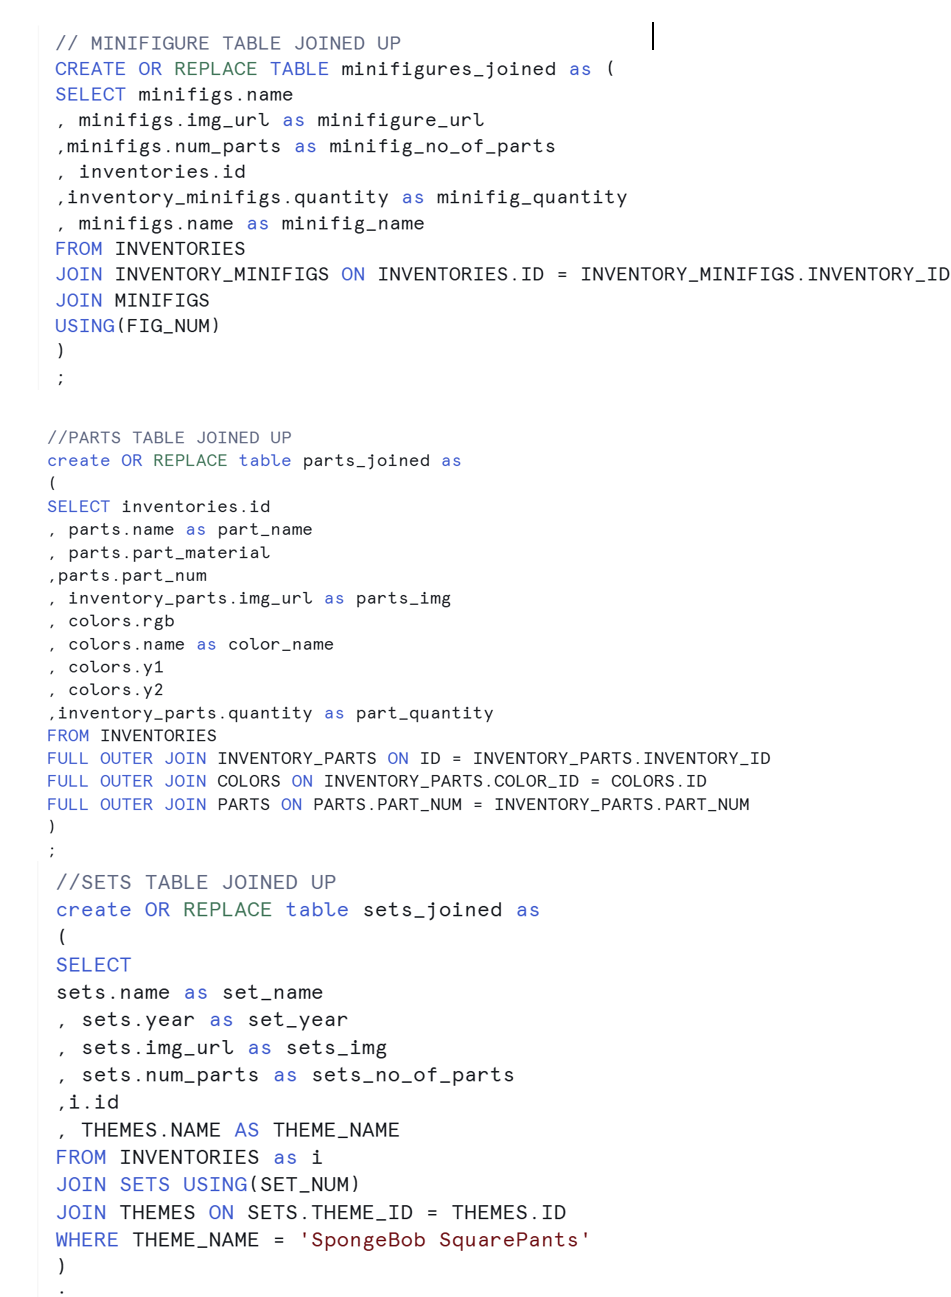
In hindsight, I should have done this as three separate views so it could be saved in conjunction with the schema!
I decided on the theme of SpongeBob as I love the show and was interested to see what Lego was out there (hence the filter in the final table). Ultimately, I should have then pulled through the ID's from this and used them to filter the other two tables.
The Dashboard
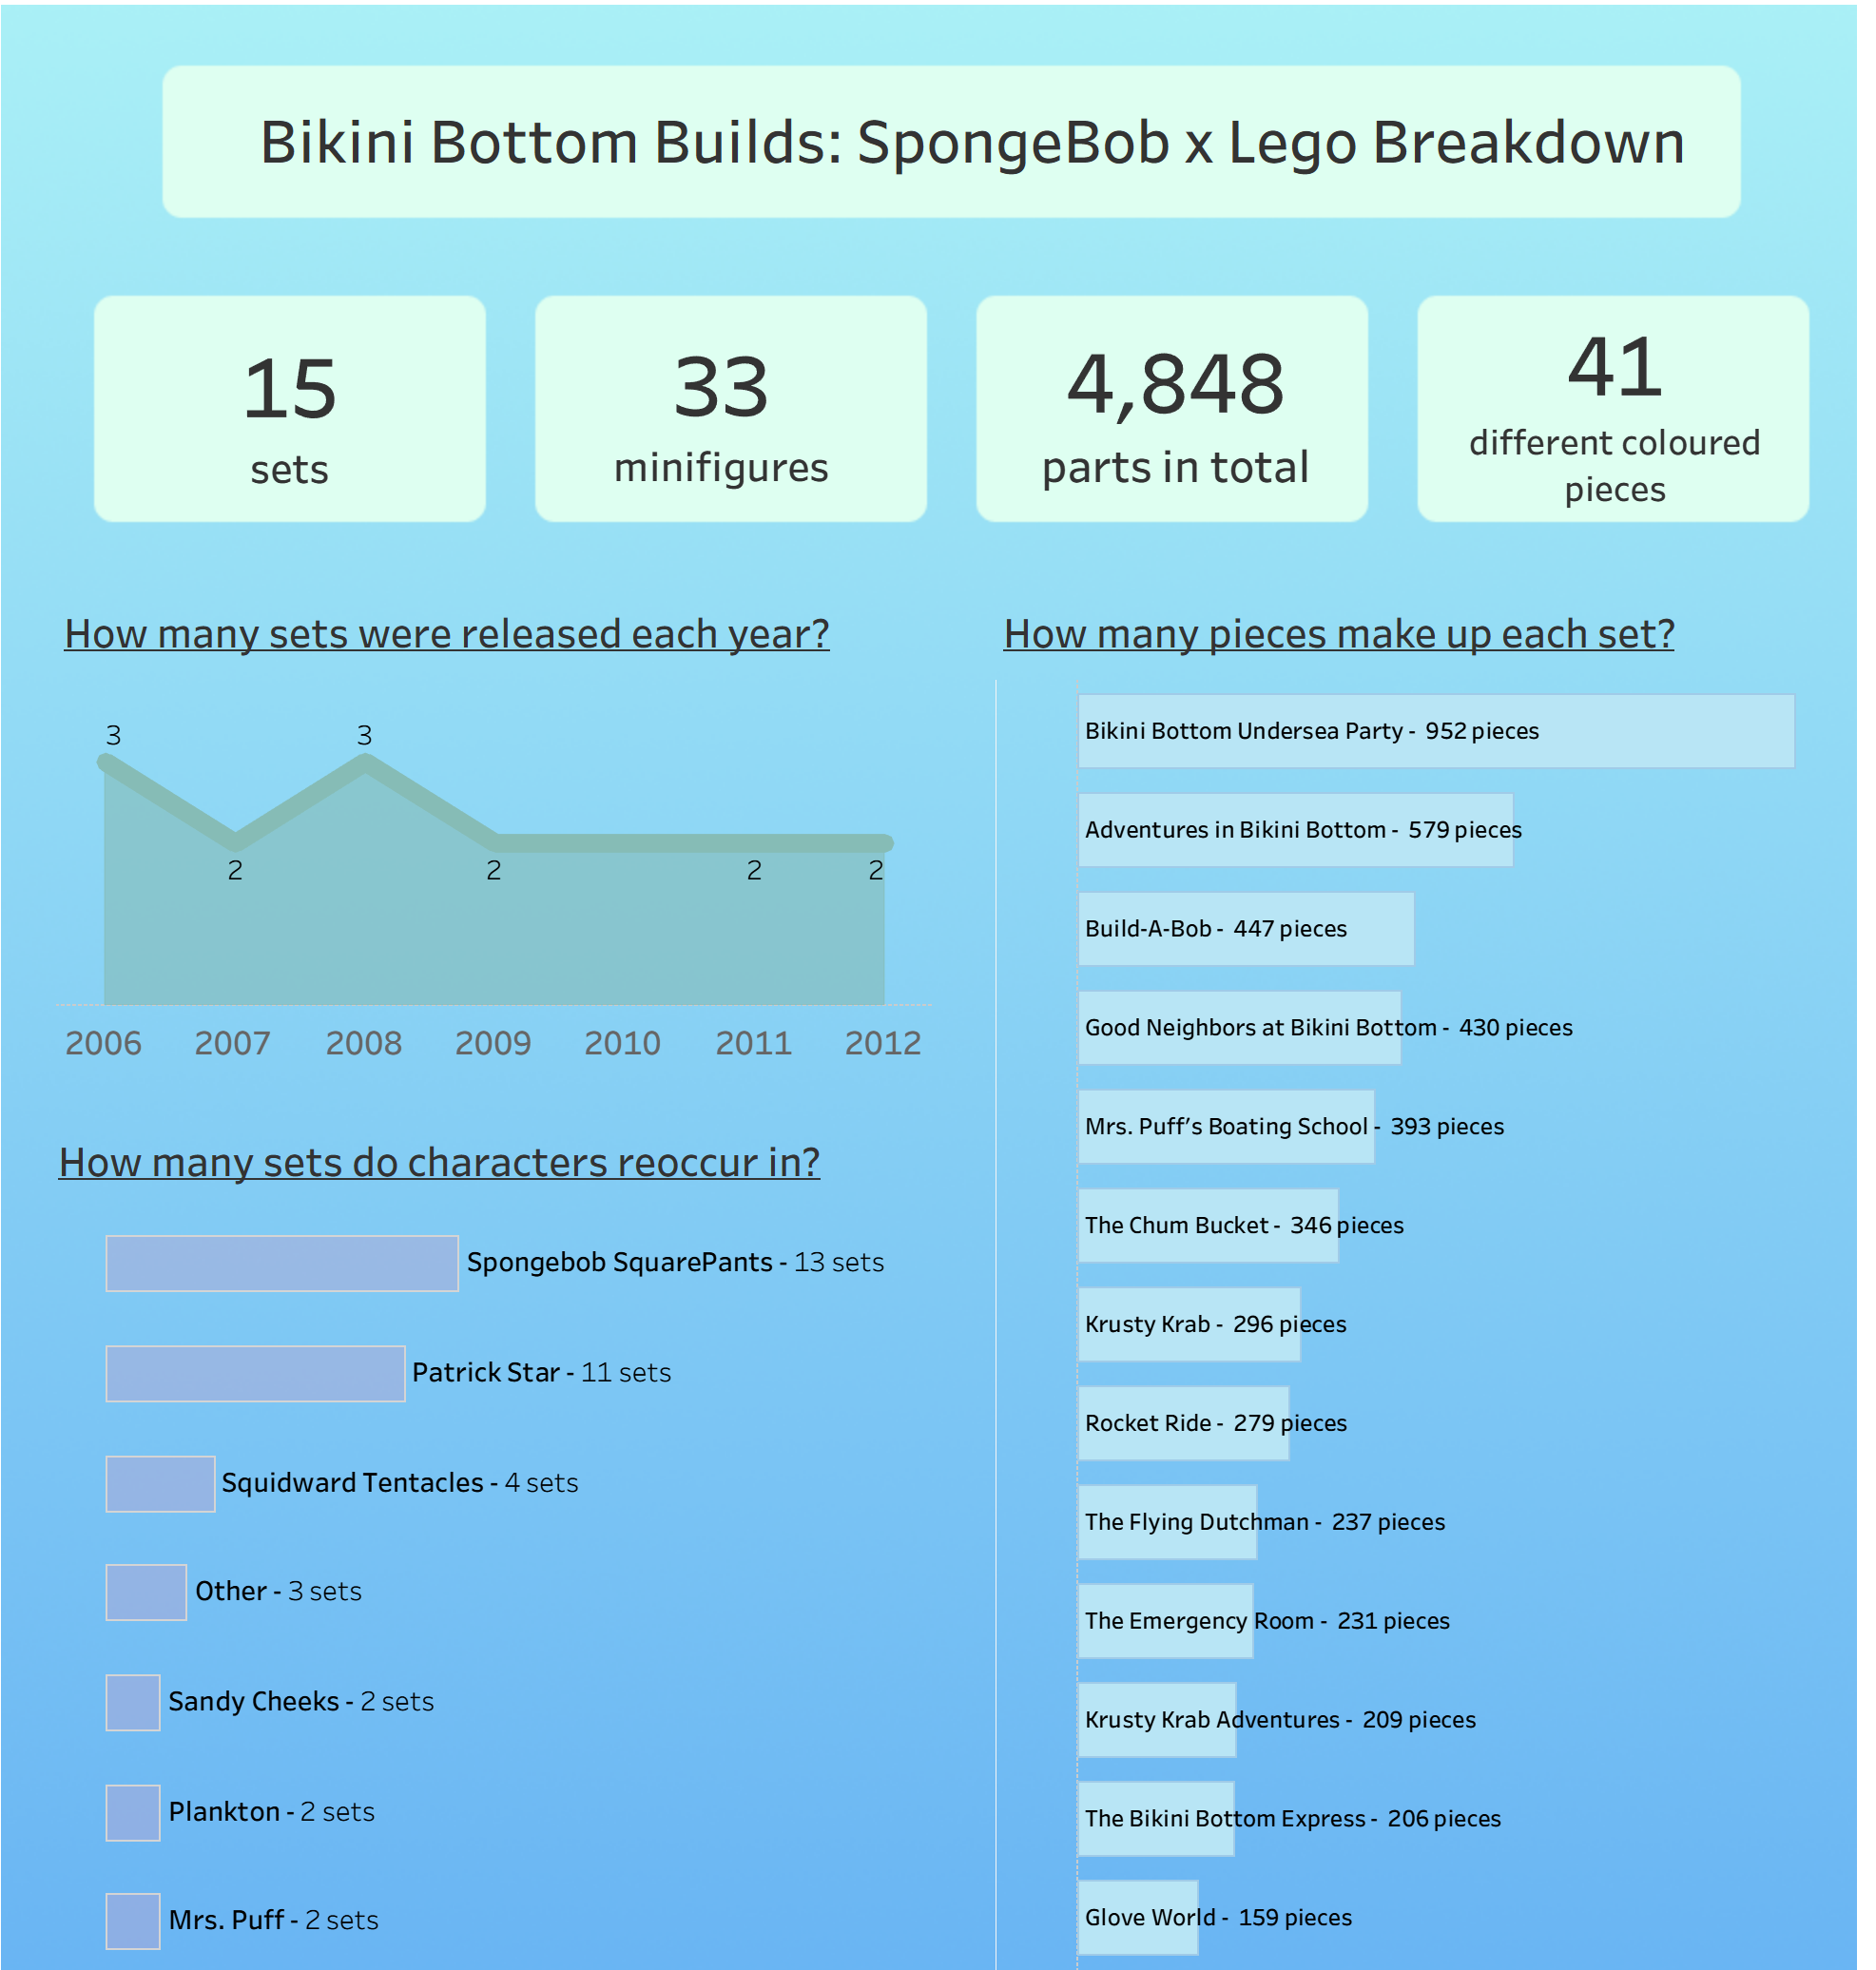
It was a simple dashboard, with a few bits of interactivity. Given the time pressure I am fairly happy with how it came out, but would have loved to create some more insightful charts. I hope to return to this and improve on it.