I was recently working on several data tables each containing hundreds of fields/columns. I later found that many of those fields were entirely, or mostly, null.
Armed with a browse and select tool, I began to check and remove fields that were 90% null or more. I quickly realised I wasn't making fast progress checking everything and removing fields one by one.
I eventually worked out how to automate the removal of fields containing 90% of nulls or higher. The beauty of this is that it can be adapted for any threshold % of nulls that you wish to remove fields by. If you are more imaginative, you can also adapt this based on other characteristics that you would like to test your data on.
Process Summary
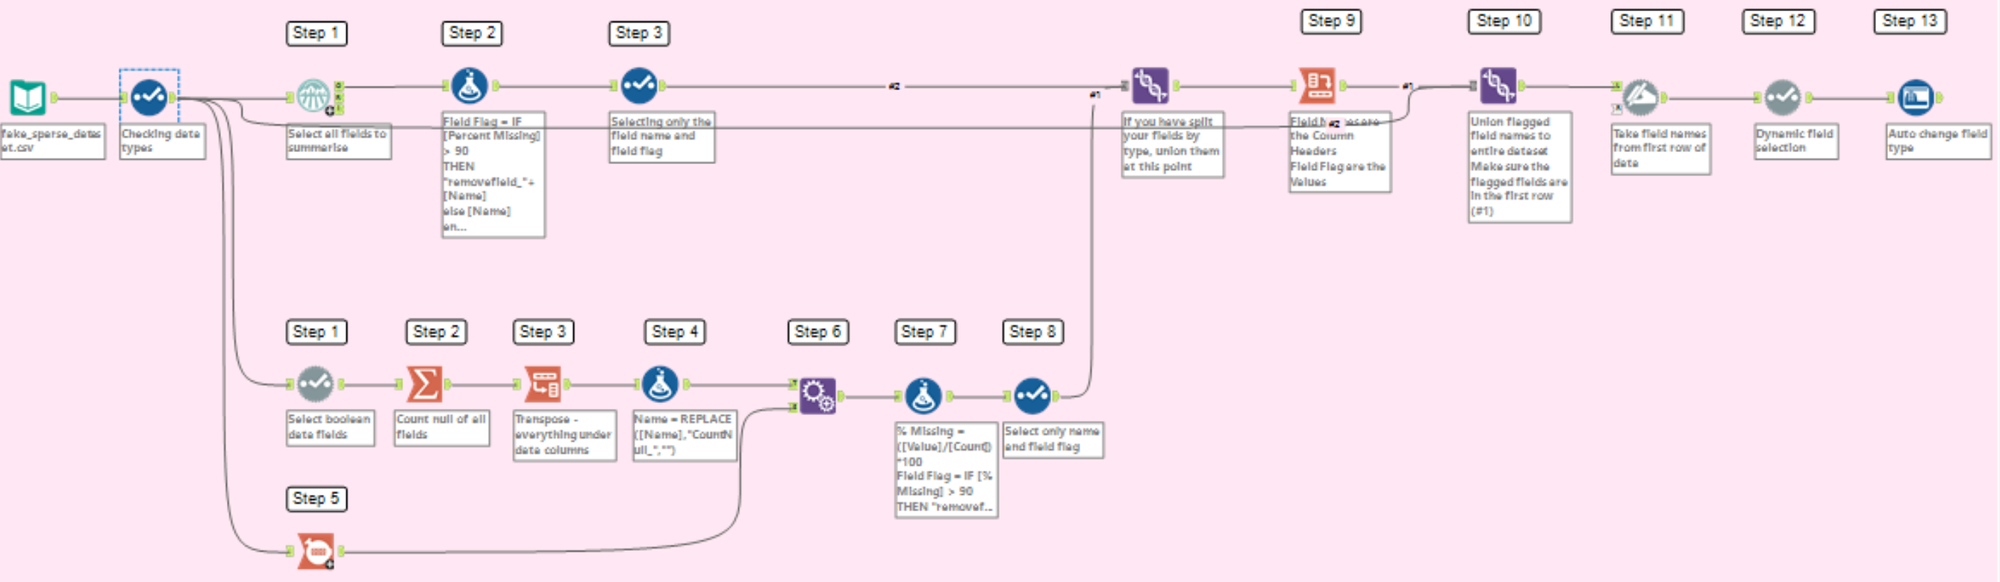
1. Summarise and identify the % of nulls in all fields. Flag fields that exceed your threshold of nulls (in this case 90%)
2. Rename the data fields using your flags
3. Remove the flagged fields
PHASE 1 - UNDERSTANDING THE % OF NULLS IN FIELDS
Your approach to this will depend on your field type - largely whether or not your fields are Boolean. My data contained both Boolean and non-Boolean fields, so I had to treat these separately for phase 1 and bring them back together for phase 2.
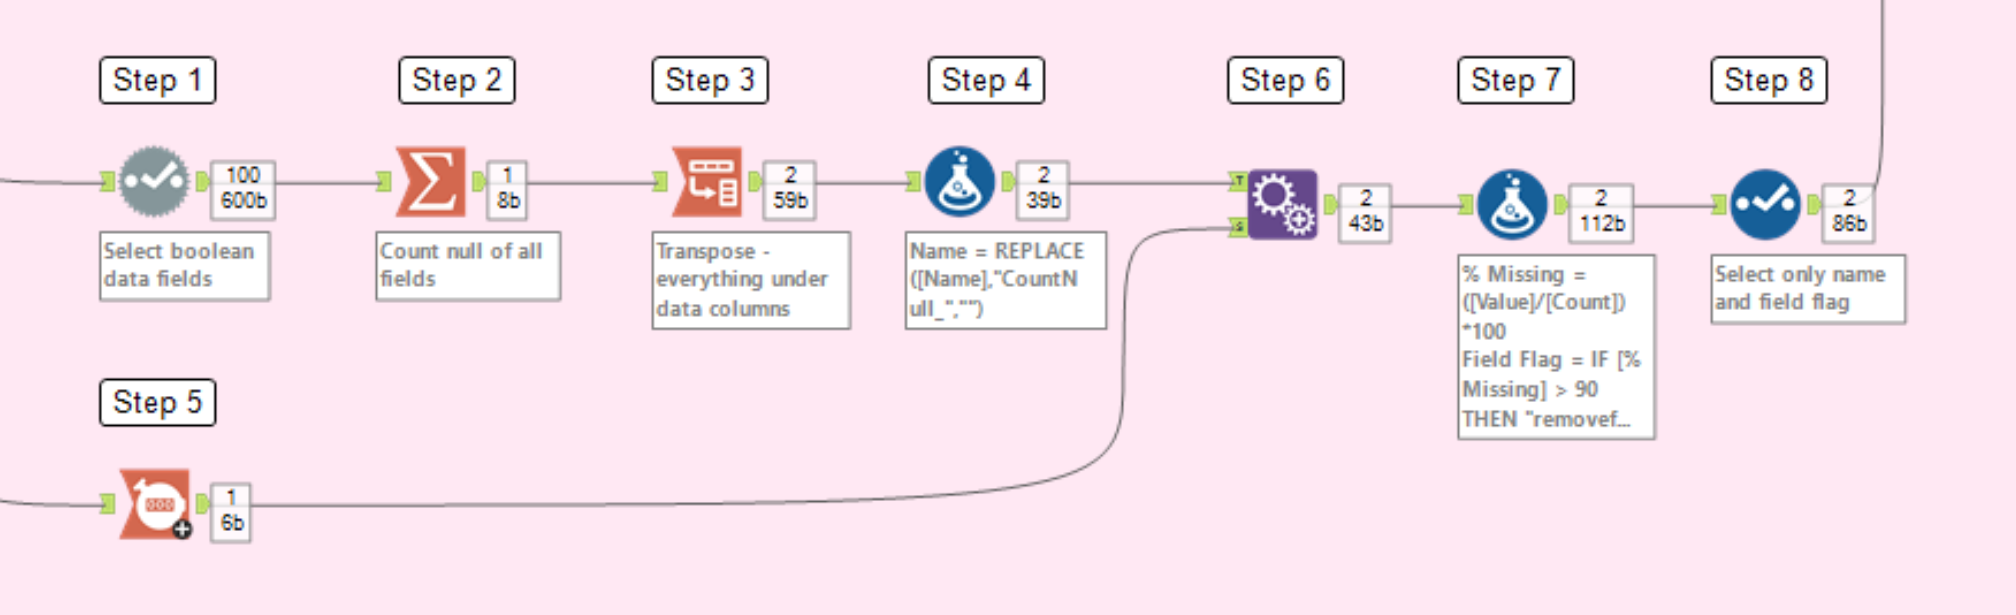
For Boolean Data Fields - this also works for other data types but requires more steps. You can ignore this method if you only want to see how to do this for other data types
1. Use the Dynamic Select tool to only select Boolean fields in your table
2. Use a Summarise tool, select all fields and Count Nulls for these - this will count the number of null rows for each field.
3. Use the Transpose tool to unpivot your data so the names of fields are in one column and number of nulls are in another column. The "Name" can be renamed to "Field Names" and "Value" can be renamed to "Number of Nulls" if you wish.
4. Use the Formula tool to remove the CountNull_ prefix to your field name
5. In a separate branch, use a Count Records tool to count the total number of rows for the entire data table.
6. Append the Total Rows created from your Count Records tool onto your table with the field names and number of rows. Your table will now have the "Field Name", "Number of Nulls", and "Count" fields.
7. Using the formula tool, we can now work out the % of nulls for all the fields.
First Formula: Creating a field called % Missing to show the % of nulls for each field
Calculated by: ([Number of Nulls]/[Count])*100
Second Formula: Creating a field called Field Flag, to show which fields need to be removed
Calculated by: IF [% Missing] > 90 THEN "removefield_"+[Field Name] ELSE [Field Name] ENDIF
This is specifically if you want to have a 90% threshold for % of nulls. If you wish to have a different threshold, change the value in the second formula.
8. Use the Select Tool to only keep [Field Name] and [Field Flag]
NOTE: At this point I union my Boolean fields with fields of other data types. If you only have Boolean fields, this step isn't necessary
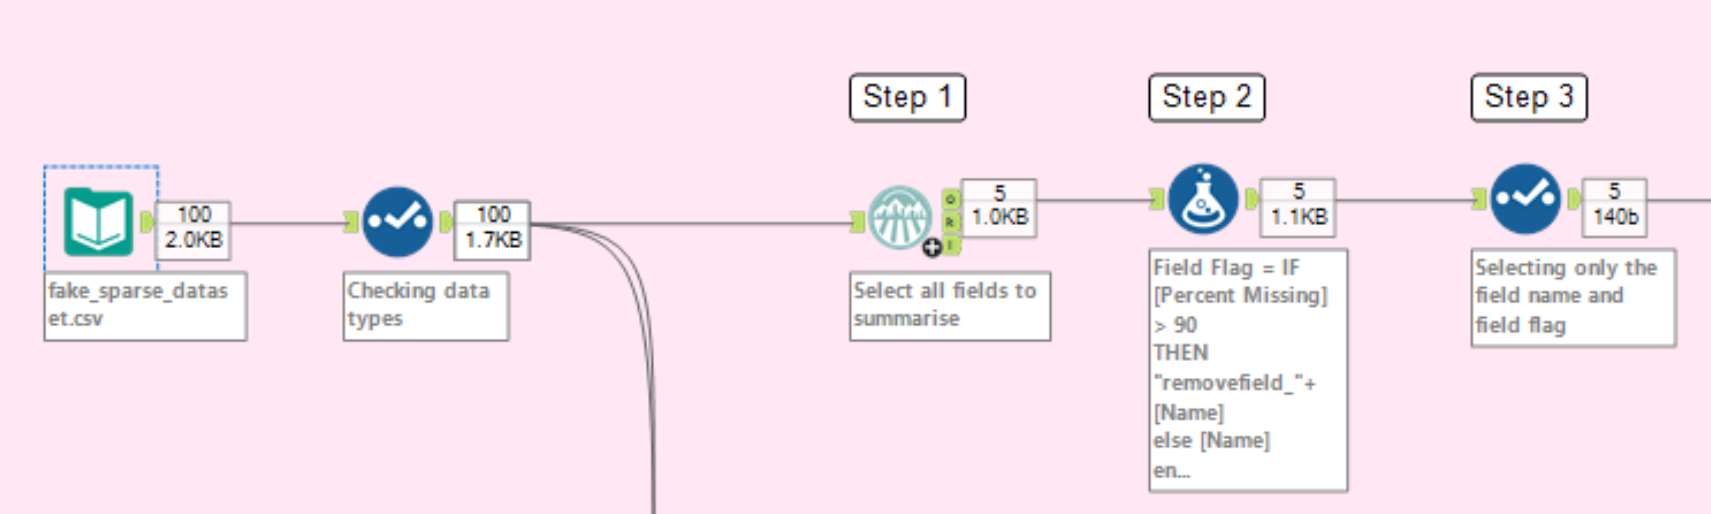
For all other Data Types - this is faster but does not work for Boolean fields
1. Use the Field Summary tool and ensure all fields are selected. Refer to the O output for summarising information on your fields. NOTE: This tool does not work on Boolean data types, hence why an alternative method has been made.
2. Use the formula tool to identify fields that need to be removed
Creating a field called Field Flag
Calculated by: IF [Percent Missing] > 90 THEN "removefield_"+[Field Name] ELSE [Field Name] ENDIF
This is specifically if you want to have a 90% threshold for % of nulls. If you wish to have a different threshold, change the value in the second formula.
3. Use the Select Tool to only keep [Name] and [Field Flag]. You can rename [Name] to [Field Name] if you like.
NOTE: If you have done this for your Boolean fields separately, now would be the point to union both of these together. Ensure your field names are consistent for both of these
PHASE 2 - RENAMING THE DATA FIELDS USING THE FLAGS
9. In order to union our data back we need to restructure our table so it matches the original data table. To do this, use the Crosstab tool to pivot your fields - Change Column Headers should be [Field Name] and Values should be [Field Flag]. The data table should now have the same number of fields and same field names as initially.
This table should only have one row.
10. Use the union tool to union your flagged fields to the original data table. In doing so, make sure your field flags are the first row in the data table. NOTE: This will force all of your field types to be strings. This will be amended later.
11. Use a Dynamic Rename tool - select all fields and Take Renames from the First Row of Data.
You will now have your original data set, with the exception that your field names containing 90%+ of nulls have been flagged with the prefix "removefield_".

PHASE 3 - REMOVE DATA FIELDS
12. Use the Dynamic Select tool to remove your flagged fields. Configure this as follows:
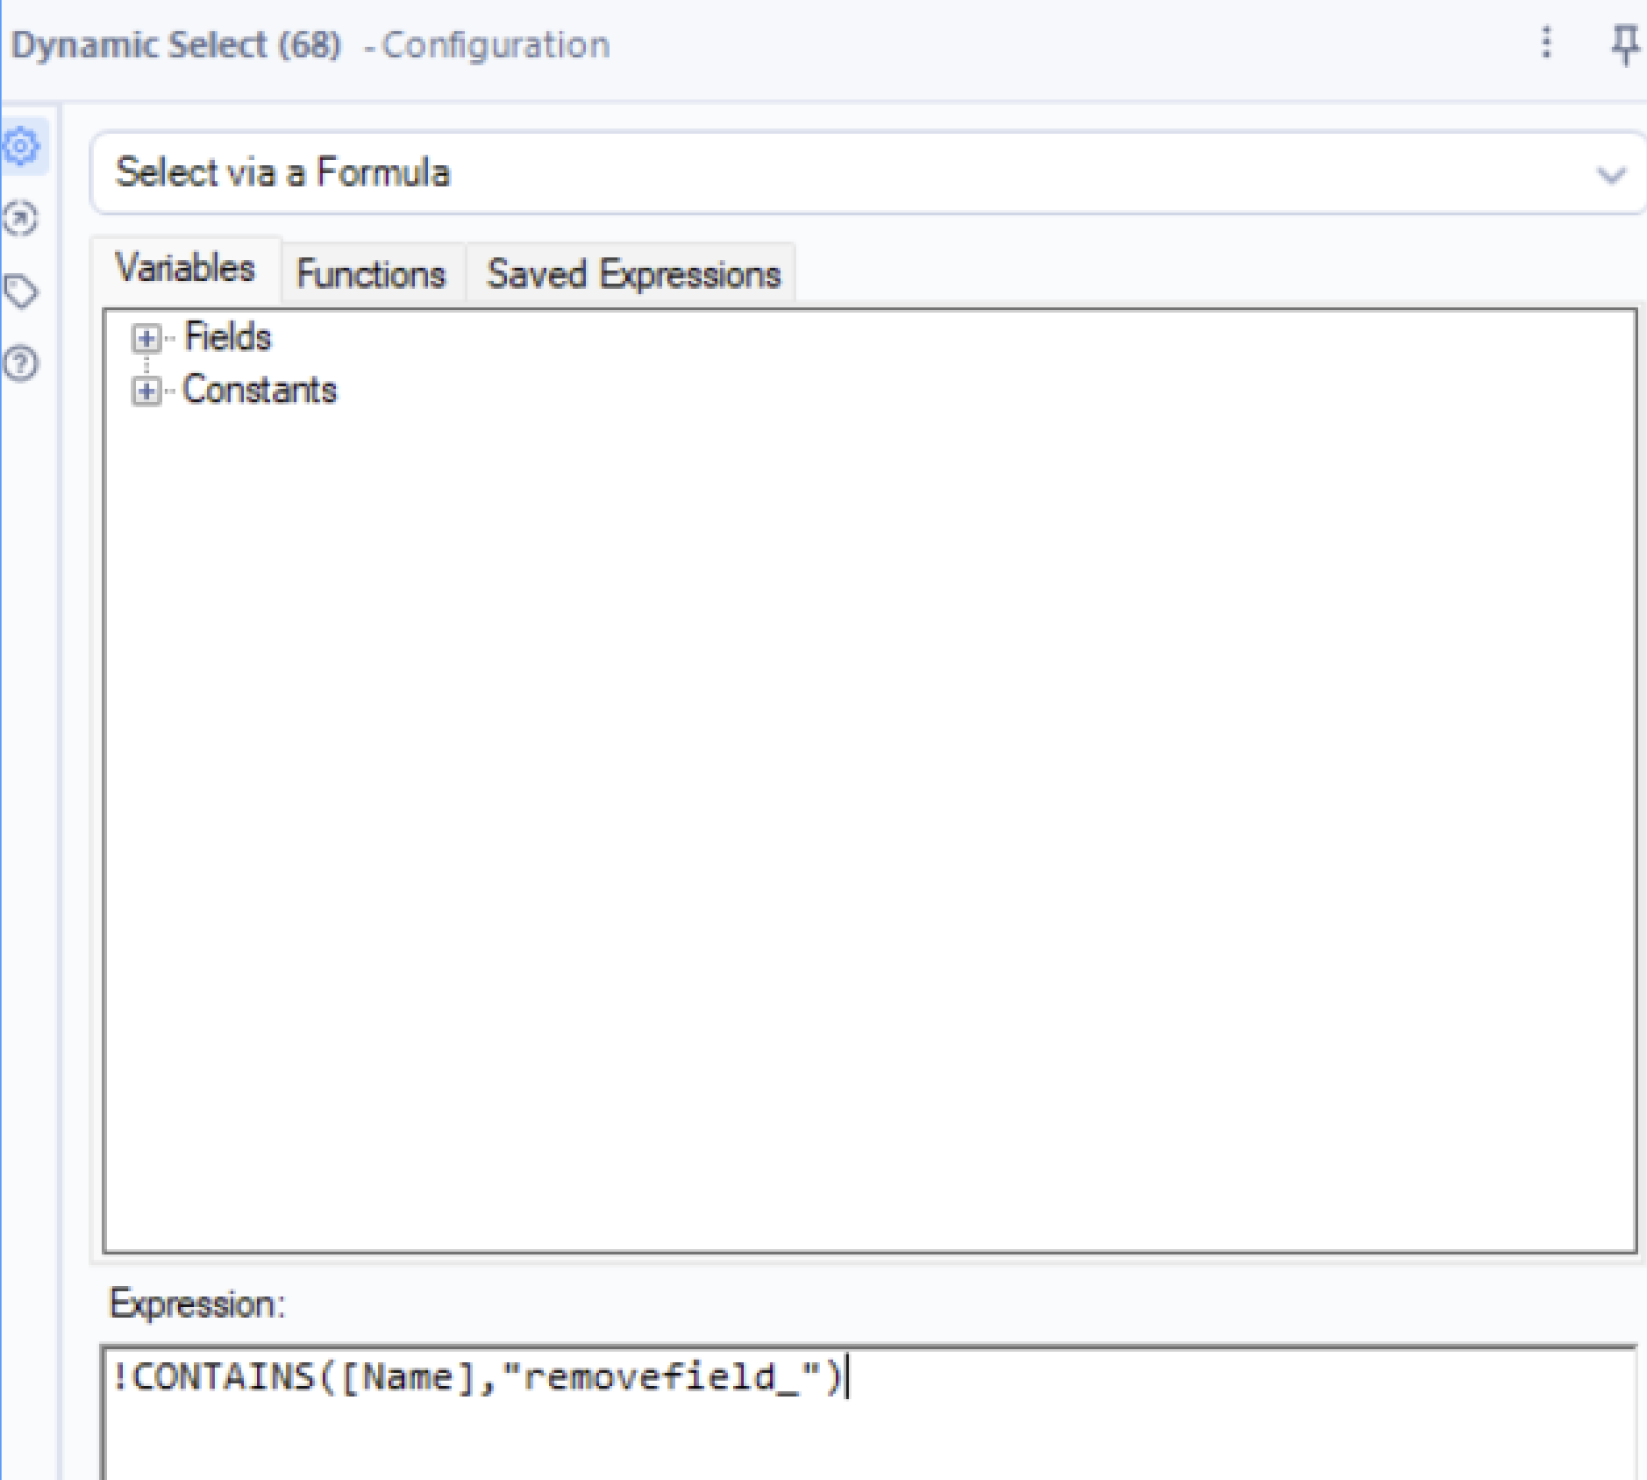
The [Name] in the expression refers specifically to the field names. You can use the Variables tab in this configuration to see what characteristics you can dynamically select by.
13. You should now have dynamically deselected your fields. To reconfigure your data types, use the Auto Field tool and select all fields. Now the flag has been removed from the data tables, this tool should re-establish your data types so they are no longer stored as strings

Workflow Summary
Your workflow will look something like this